目錄
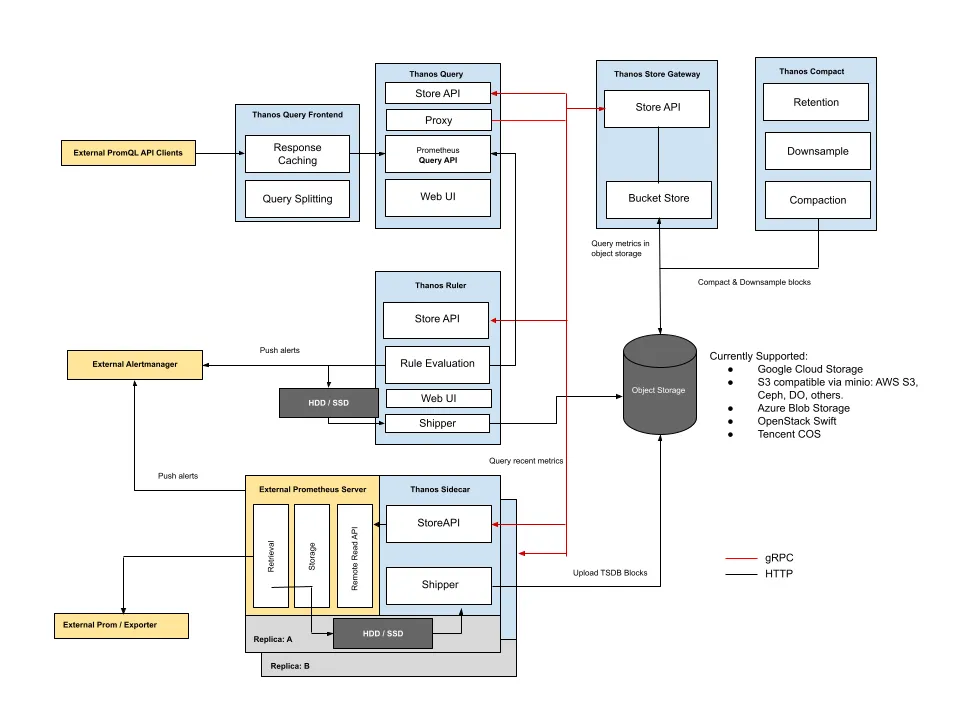
前情提要與架構規劃
官方Github: https://github.com/thanos-io/thanos
參考專案: https://github.com/thanos-community/thanos-docker-compose
由於此專案演示的,是將所有角色在單機上佈屬,
然後我這裡是要示範,如何在跨節點主機上,去佈屬各項角色,達到角色拆分。
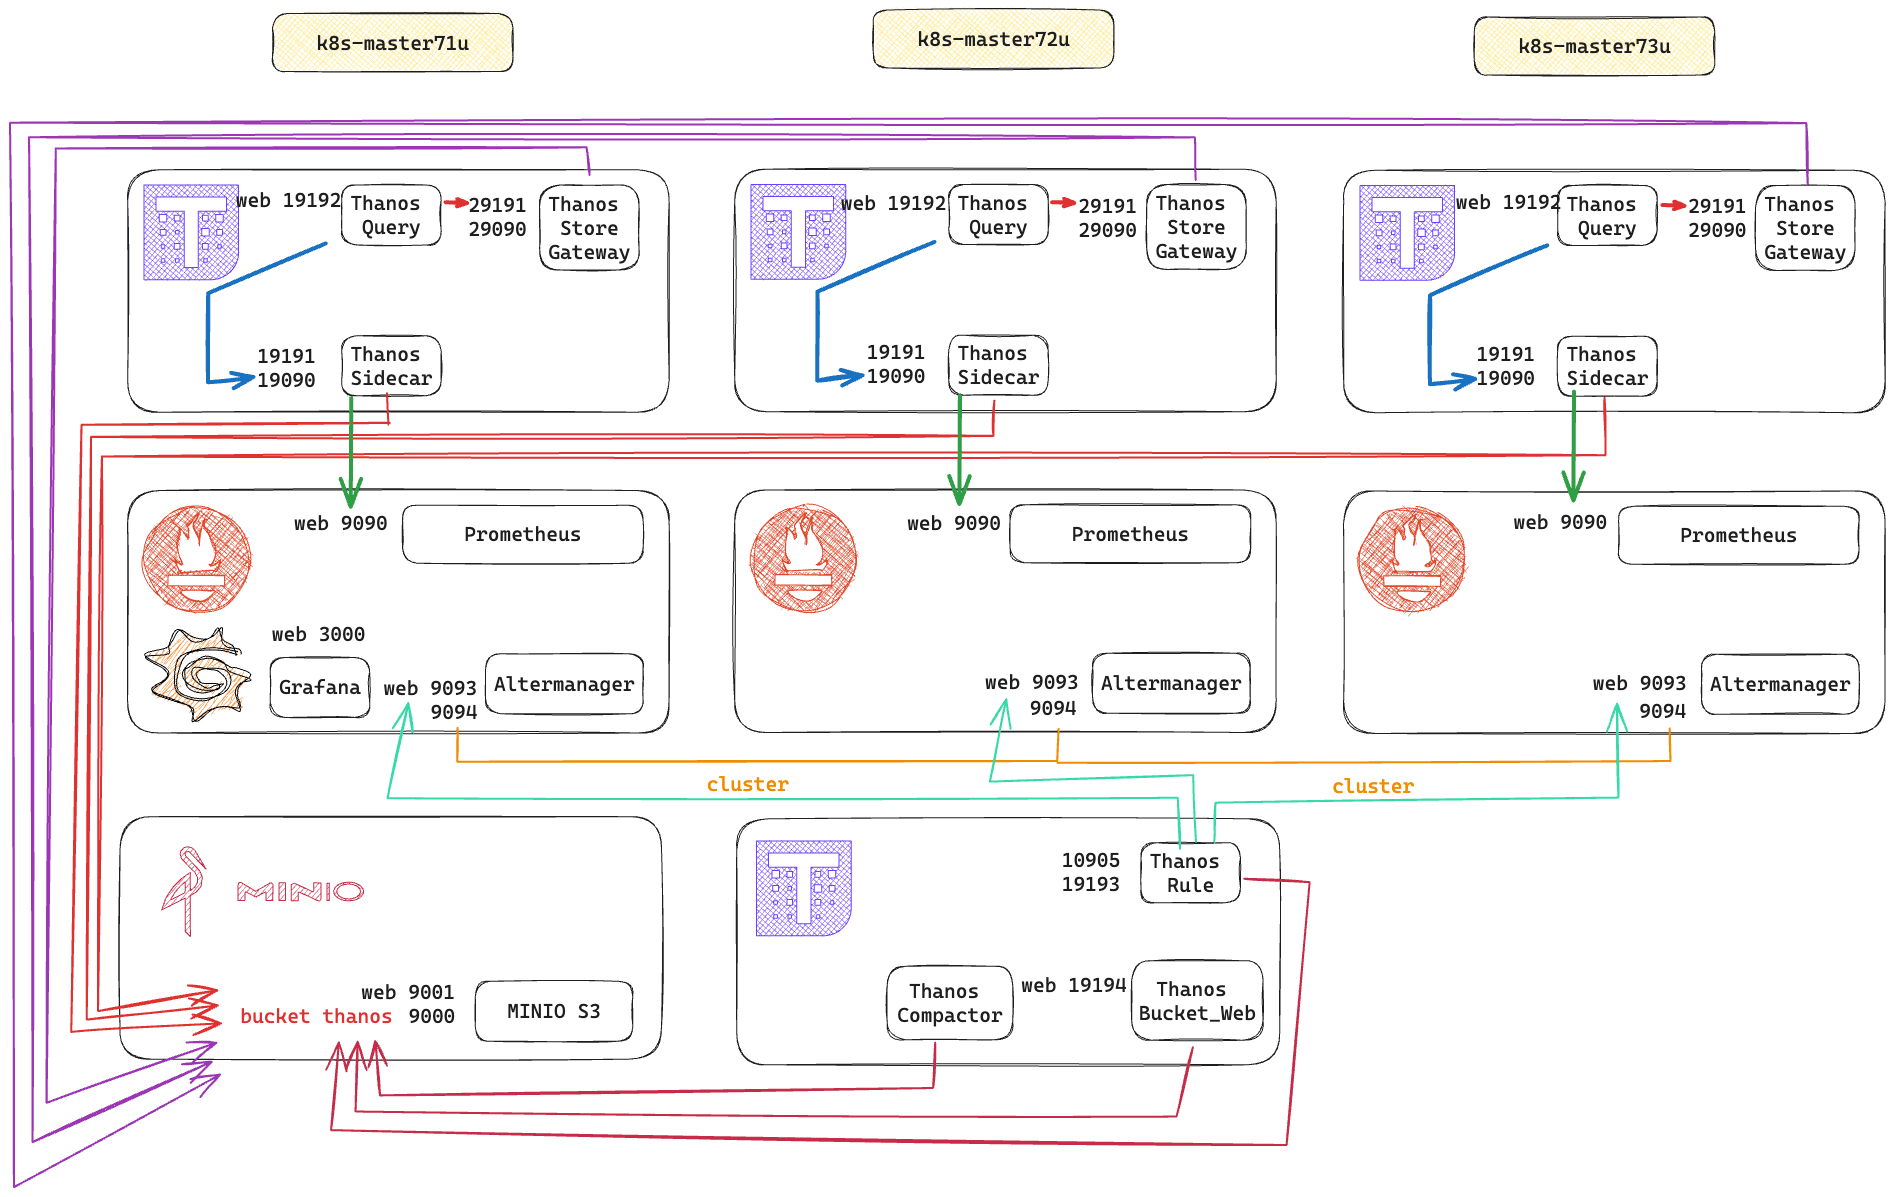
主機規劃,與角色分配
| 主機名稱 | 主機IP | 主機效能 | 共用角色 | 單獨角色 |
|---|---|---|---|---|
| k8s-master71u | 192.168.1.71 | 8core 8g | prometheus1,sidecar1,alertmanager1,query1,storer1 | minio,grafana |
| k8s-master72u | 192.168.1.72 | 8core 8g | prometheus2,sidecar2,alertmanager2,query2,storer2 | compactor,bucket web,ruler |
| k8s-master73u | 192.168.1.73 | 8core 8g | prometheus3,sidecar3,alertmanager3,query3,storer3 |
step0 整體專案目錄架構
root@k8s-master71u:/data/thanos-docker-compose# tree -a
# 目錄結構
.
├── alertmanager
│   ├── conf
│   │   ├── alertmanager.yml
│   │   └── email.tmpl
│   ├── data
│   │   └── .gitignore
│   └── template
├── docker-compose.yml
├── etc
│   ├── localtime
│   └── timezone
├── prometheus
│   ├── conf
│   │   ├── prometheus.yml
│   │   ├── rules
│   │   │   └── alert.yml
│   │   └── sd_config
│   │       └── t1zone-redis
│   │       │   └── web-front.json
│   │       └── t2zone-redis
│   │           └── search.json
│   └── data
│      └── .gitignore
├── README.md
└── thanos
    ├── compact_data
    │   └── .gitignore
    ├── conf
    │   ├── bucket_config.yaml
    │   ├── query.yaml
    │   └── store.yaml
    └── rule_data
        ├── conf
        ├── data
        ├── .gitignore
        └── rules
docker-compose.yml
docker-compose.yml需依照環境修改部分:
# 1. thanos_sidecar_one 填寫當下安裝prometheus的主機IP

- "--prometheus.url=http://192.168.1.71:9090"

# 2. thanos_rule 依據當下安裝prometheus的external_labels填寫,每一台prometheus的replica名稱一定要不一樣
      - "--label=region=\"JIMMYHOME\""
      - "--label=replica=\"A\""

# 3. alertmanager 填寫當下安裝alertmanager的主機IP
      - '--cluster.peer=192.168.1.7:9094'
      - '--cluster.peer=192.168.1.8:9094'
      - '--cluster.peer=192.168.1.9:9094'
version: '3.2'
services:
  minio:
    image: minio/minio
    container_name: minio
    user: root
    volumes:
      - ./minio/data:/data/minio/data
      - ./minio/config:/root/.minio
      - ./etc/localtime:/etc/localtime
      - ./etc/timezone:/etc/timezone
    ports:
      - "9000:9000"
      - "9001:9001"
    environment:
      MINIO_PROMETHEUS_AUTH_TYPE: public
      MINIO_ROOT_USER: admin
      MINIO_ROOT_PASSWORD: admin123456
    command: server /data/minio/data --console-address ":9001"
    healthcheck:
      test: ["CMD", "curl", "-f", "http://localhost:9001/minio/health/live"]
      interval: 30s
      timeout: 20s
      retries: 3
    restart: unless-stopped

  prometheus_one:
    image: prom/prometheus:v2.47.2
    container_name: prometheus_one
    user: root
    volumes:
      - ./prometheus/conf/prometheus.yml:/etc/prometheus/prometheus.yml
      - ./prometheus/conf/rules:/etc/prometheus/rules
      - ./prometheus/conf/sd_config:/etc/prometheus/sd_config
      - ./prometheus/data:/data/prometheus/data
      - ./etc/localtime:/etc/localtime
      - ./etc/timezone:/etc/timezone
    command:
      - '--web.read-timeout=5m'
      - '--config.file=/etc/prometheus/prometheus.yml'
      - '--storage.tsdb.path=/data/prometheus/data'
      - '--web.max-connections=512'
      - '--storage.tsdb.retention=30d'
      - '--query.timeout=2m'
      - '--web.enable-lifecycle'
      - '--web.listen-address=:9090'
      - '--web.enable-admin-api'
      - '--storage.tsdb.min-block-duration=2h'
      - '--storage.tsdb.max-block-duration=2h'
    restart: unless-stopped
    expose:
      - 9090
    ports:
      - "9090:9090"

  # prometheus_two:
  #   image: prom/prometheus:v2.21.0
  #   container_name: prometheus_two
  #   user: root
  #   volumes:
  #     - ./prometheus:/etc/config/
  #     - ./data/prometheus/two:/data
  #   command:
  #     - '--config.file=/etc/config/prometheus_two.yml'
  #     - '--storage.tsdb.path=/data'
  #     - '--web.console.libraries=/etc/prometheus/console_libraries'
  #     - '--web.console.templates=/etc/prometheus/consoles'
  #     - '--storage.tsdb.retention.time=2h'
  #     - '--web.enable-lifecycle'
  #     - '--web.enable-admin-api'
  #     - '--web.listen-address=:9002'
  #     - '--storage.tsdb.min-block-duration=5m'
  #     - '--storage.tsdb.max-block-duration=5m'
  #   restart: unless-stopped
  #   expose:
  #     - 9002

  alertmanager:
    image: prom/alertmanager:v0.26.0
    container_name: alertmanager
    user: root
    volumes:
      - ./alertmanager/conf/:/etc/alertmanager/
      - ./alertmanager/data:/alertmanager
      - ./etc/localtime:/etc/localtime
      - ./etc/timezone:/etc/timezone
    command:
      - '--config.file=/etc/alertmanager/alertmanager.yml'
      - '--cluster.listen-address=0.0.0.0:9094'
      - '--cluster.peer=192.168.1.71:9094'
      - '--cluster.peer=192.168.1.72:9094'
      - '--cluster.peer=192.168.1.73:9094'
    restart: unless-stopped
    expose:
      - 9093
      - 9094
    ports:
      - "9093:9093"
      - "9094:9094"


  thanos_sidecar_one:
    image: thanosio/thanos:v0.32.5
    container_name: thanos_sidecar_one
    user: root
    volumes:
      - ./prometheus/conf/prometheus.yml:/etc/prometheus/prometheus.yml
      - ./prometheus/data:/data/prometheus/data
      - ./thanos/conf/bucket_config.yaml:/bucket_config.yaml
      - ./etc/localtime:/etc/localtime
      - ./etc/timezone:/etc/timezone
    command:
      - "sidecar"
      - "--log.level=debug"
      - "--tsdb.path=/data/prometheus/data"
      - "--reloader.config-file=/etc/prometheus/prometheus.yml"
      - "--prometheus.url=http://192.168.1.71:9090"
      - "--objstore.config-file=/bucket_config.yaml"
      - "--http-address=0.0.0.0:19191"
      - "--grpc-address=0.0.0.0:19090"
    restart: unless-stopped
    network_mode: "host"
    expose:
      - 19191
      - 19090
    # depends_on:
    #   - minio

  # thanos_sidecar_two:
  #   build:
  #     context: ./thanos
  #     dockerfile: Dockerfile.thanos
  #   container_name: thanos_sidecar_two
  #   user: root
  #   volumes:
  #     - ./prometheus:/etc/config/
  #     - ./data/prometheus/two:/data
  #   command:
  #     - "/wait-for-it.sh"
  #     - "prometheus_two:9002"
  #     - "--"
  #     - "/thanos"
  #     - "sidecar"
  #     - "--log.level=debug"
  #     - "--tsdb.path=/data"
  #     - "--prometheus.url=http://prometheus_two:9002"
  #     - "--reloader.config-file=/etc/config/prometheus_two.yml"
  #     - |
  #         --objstore.config=type: S3
  #         config:
  #           bucket: thanos-data-bucket
  #           access_key: myaccesskey
  #           secret_key: mysecretkey
  #           endpoint: minio:9000
  #           insecure: true
  #   expose:
  #     - 10902
  #     - 10901
  #   depends_on:
  #     - minio

  thanos_querier:
    image: thanosio/thanos:v0.32.5
    container_name: thanos_querier
    user: root
    volumes:
      - ./thanos/conf/store.yaml:/store.yaml
      - ./etc/localtime:/etc/localtime
      - ./etc/timezone:/etc/timezone
    command:
      - "query"
      - "--http-address=0.0.0.0:19192"
      - "--store.sd-files=/store.yaml"
      - "--query.replica-label=replica"
      - "--log.level=debug"
      - "--log.format=logfmt"
    restart: unless-stopped
    expose:
      - 19192
    ports:
      - "19192:19192"
    # depends_on:
    #   - minio

  thanos_store:
    image: thanosio/thanos:v0.32.5
    container_name: thanos_store
    user: root
    volumes:
      - ./thanos/conf/bucket_config.yaml:/bucket_config.yaml
      - ./etc/localtime:/etc/localtime
      - ./etc/timezone:/etc/timezone
    command:
      - "store"
      - "--data-dir=/var/thanos/store"
      - "--objstore.config-file=/bucket_config.yaml"
      - "--http-address=0.0.0.0:19191"
      - "--grpc-address=0.0.0.0:19090"
      - "--log.level=debug"
      - "--log.format=logfmt"
      - "--index-cache-size=1GB"
      - "--chunk-pool-size=8GB"
    restart: unless-stopped
    expose:
      - 29191
      - 29090
    # depends_on:
    #   - minio
    ports:
      - '29191:19191'
      - '29090:19090'

  grafana:
    image: grafana/grafana:9.0.3
    container_name: grafana
    user: root
    volumes:
      - ./grafana/data:/var/lib/grafana
      - ./etc/localtime:/etc/localtime
      - ./etc/timezone:/etc/timezone
    environment:
      - TZ="Asia/Taipei"
      - GF_SECURITY_ADMIN_PASSWORD=admin123456
    restart: unless-stopped
    ports:
      - "3000:3000"

  thanos_compactor:
    image: thanosio/thanos:v0.32.5
    container_name: thanos_compactor
    volumes:
      - ./thanos/conf/bucket_config.yaml:/bucket_config.yaml
      - ./thanos/compact_data:/var/thanos/compact
      - ./etc/localtime:/etc/localtime
      - ./etc/timezone:/etc/timezone
    command:
      - "compact"
      - "--log.level=debug"
      - "--log.format=logfmt"
      - "--data-dir=/var/thanos/compact"
      - "--objstore.config-file=/bucket_config.yaml"
      - "--http-address=0.0.0.0:19191"
      - "--wait"
    restart: unless-stopped
    # depends_on:
    #   - minio

  bucket_web:
    image: thanosio/thanos:v0.32.5
    container_name: bucket_web
    user: root
    volumes:
      - ./thanos/conf/bucket_config.yaml:/bucket_config.yaml
      - ./etc/localtime:/etc/localtime
      - ./etc/timezone:/etc/timezone
    command:
      - "tools"
      - "bucket"
      - "web"
      - "--objstore.config-file=/bucket_config.yaml"
      - "--http-address=0.0.0.0:19194"
    restart: unless-stopped
    expose:
      - 19194
    ports:
      - "19194:19194"

  thanos_rule:
    image: thanosio/thanos:v0.32.5
    container_name: thanos_rule
    user: root
    volumes:
      - ./thanos/rule_data/data:/data
      - ./thanos/rule_data/rules:/rules
      - ./thanos/conf/bucket_config.yaml:/bucket_config.yaml
      - ./thanos/rule_data/conf/:/conf/
      - ./etc/localtime:/etc/localtime
      - ./etc/timezone:/etc/timezone
    command:
      - "rule"
      - "--grpc-address=0.0.0.0:10905"
      - "--http-address=0.0.0.0:19193"
      - "--data-dir=/data"
      - "--eval-interval=30s"
      - "--rule-file=/rules/*.yml"
      - "--query.sd-files=/conf/query.yml"
      - "--objstore.config-file=/bucket_config.yaml"
      - "--alertmanagers.url=http://192.168.1.71:9093"
      - "--alertmanagers.url=http://192.168.1.72:9093"
      - "--alertmanagers.url=http://192.168.1.73:9093"
      - "--label=region=\"JIMMYHOME\""
      - "--label=replica=\"A\""
      - "--alert.label-drop=replica"
      - "--log.level=debug"
      - "--log.format=logfmt"
    expose:
      - 10905
      - 19193
    # depends_on:
    #   - minio
    ports:
      - '10905:10905'
      - '19193:19193'

  # thanos_query_frontend:
  #   build:
  #     context: ./thanos
  #     dockerfile: Dockerfile.thanos
  #   container_name: thanos_query_frontend
  #   user: root
  #   command:
  #     - "/wait-for-it.sh"
  #     - "thanos_querier:10901"
  #     - "--"
  #     - "/thanos"
  #     - "query-frontend"
  #     - "--log.level=debug"
  #     - "--log.format=logfmt"
  #     - "--http-address=0.0.0.0:19090"
  #     - "--query-frontend.compress-responses"
  #     - "--query-range.partial-response"
  #     - "--query-frontend.downstream-url=http://thanos_querier:10902"
  #     - "--query-range.split-interval=24h"
  #     - "--query-range.max-retries-per-request=5"
  #     - "--query-frontend.log-queries-longer-than=5s"
  #     - "--cache-compression-type=snappy"
  #   ports:
  #     - "19090:19090"
  #   depends_on:
  #     - thanos_querier

  # debug:
  #   build:
  #     context: thanos
  #     dockerfile: Dockerfile.debug
  #   container_name: debug
  #   user: root
  #   stdin_open: true
  #   tty: true
  #   expose:
  #     - 10902
  #     - 10901
  #   ports:
  #     - "10902:10902"
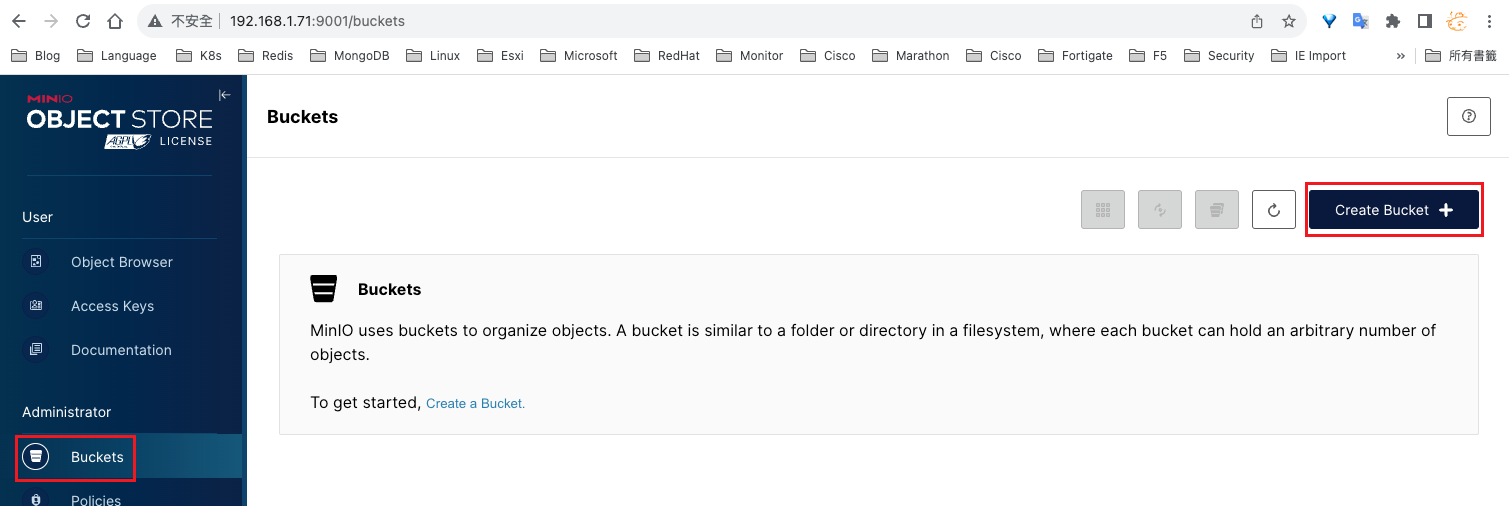
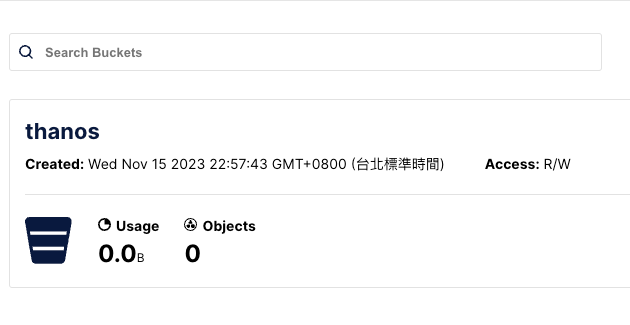
step1 minio
主機: k8s-master71u (192.168.1.71)
mkdir -p ./minio/{data,config}
chmod -R 777 ./minio/data

root@k8s-master71u:/data/thanos-docker-compose# docker-compose up -d minio

root@k8s-master71u:/data/thanos-docker-compose# docker-compose ps
Name               Command                       State                                               Ports
----------------------------------------------------------------------------------------------------------------------------------------------
minio   /usr/bin/docker-entrypoint ...   Up (health: starting)   0.0.0.0:9000->9000/tcp,:::9000->9000/tcp,
                                                                 0.0.0.0:9001->9001/tcp,:::9001->9001/tcp

step2 prometheus alertmanager
主機: k8s-master71u (192.168.1.71)、k8s-master72u (192.168.1.72)、k8s-master73u (192.168.1.73)
mkdir -p ./prometheus/{data,conf,conf/rules,conf/sd_config}
chown -R  65534:65534 ./prometheus/data
chmod -R 777 ./prometheus/data

mkdir -p ./alertmanager/{conf,template,data}
chown -R 65534:65534 ./alertmanager/data
chmod -R 777 ./alertmanager/data
prometheus設定檔
cat > ./prometheus/conf/prometheus.yml << 'EOF'
global:
  scrape_interval:     1s
  evaluation_interval: 1s
  #scrape_timeout:      10s
  #以下external_labels,不同的prometheus有不同的值,否則會導致安裝失敗
  external_labels:
    region: JIMMYHOME
    replica: A
#加載警報規則
rule_files:
  - "/etc/prometheus/rules/*.yml"
#集成alertmanager高可用
alerting:
  alertmanagers:
  - static_configs:
    - targets:
      - 192.168.1.71:9093
      - 192.168.1.72:9093
      - 192.168.1.73:9093
    timeout: 10s

scrape_configs:
  #promethes自身的監控
  - job_name: prometheus
    metrics_path: '/metrics' #默認
    scheme: 'http'  #默認
    scrape_interval: 1s    #覆蓋全局
    static_configs:
      - targets: ['localhost:9090']
        labels:
          instance: prometheus
  #有安裝grafana才用
  - job_name: grafana
    metrics_path: /metrics
    static_configs:
    - targets:
      - 192.168.1.71:3000
  - job_name: thanos_sidecar
    static_configs:
    - targets:
      - 192.168.1.71:19191
      - 192.168.1.72:19191
      - 192.168.1.73:19191
EOF


cat >./prometheus/conf/rules/alert.yml<< 'EOF'
groups:
  - name: prometheus
    rules:
      - alert: prometheus節點UP狀態
        expr: sum(up{job="prometheus"})==0
        for: 1m
        labels:
          severity: 嚴重
          team: node-prometheus
        annotations:
          summary: "{{ $labels.job }} 已停止運作超過 1分鐘!"
          description: "{{ $labels.instance }} 異常停止,請盡快處理!"
          value: '{{ $value }}'
EOF
alertmanager設定檔
cat > ./alertmanager/conf/alertmanager.yml << 'EOF'
global:
  resolve_timeout: 5m
  # 郵件服務器
  smtp_smarthost: '192.168.1.74:25'
  smtp_from: '[email protected]'
  #smtp_auth_username: '[email protected]'
  #smtp_auth_password: 'xxx'
  smtp_require_tls: false

templates:
  - '/etc/alertmanager/email.tmpl' #郵件模板文件,容器內的路徑

route:
  group_by: ['alertname'] # 根據告警規則组名進行分組
  group_wait: 1m # 分组内第一個告警等待時間,10s内如有第二個告警會合併一個告警
  group_interval: 1m # 發送新告警間隔時間
  repeat_interval: 5m # 重複告警間隔發送時間
  #receiver: 'web.hook'
  receiver: 'mail'
receivers:
  #- name: 'web.hook'
  #  webhook_configs:
  #    - url: 'http://127.0.0.1:5001/'
  - name: 'mail'
    email_configs:
    - to: '[email protected]'

inhibit_rules:
  - source_match:
      level: 'high' #指定告警級別
    target_match:
      level: 'warning' #指定抑制告警級別
    equal: ['alertname', 'instance']
EOF


cat >  ./alertmanager/conf/email.tmpl<< 'EOF'
{{ define "email.jwolf.html" }}
{{ range $i ,$alert := .Alerts }}
=========start==========<br>
告警級別: {{ $alert.Labels.severity }} <br>
告警類型: {{ $alert.Labels.alertname }} <br>
故警主機: {{ $alert.Labels.instance }} <br>
告警主體: {{ $alert.Annotations.summary }} <br>
告警詳情: {{ $alert.Annotations.description }} <br>
告警閥值: {{ $alert.Annotations.value }} <br>
觸發時間: {{ $alert.StartsAt }} <br>
=========end==========<br>
{{ end }}
{{ end }}
EOF
啟動prometheus alertmanager
root@k8s-master71u:/data/thanos-docker-compose# docker-compose up -d prometheus_one
root@k8s-master72u:/data/thanos-docker-compose# docker-compose up -d prometheus_one
root@k8s-master73u:/data/thanos-docker-compose# docker-compose up -d prometheus_one

root@k8s-master71u:/data/thanos-docker-compose# docker-compose up -d alertmanager
root@k8s-master72u:/data/thanos-docker-compose# docker-compose up -d alertmanager
root@k8s-master73u:/data/thanos-docker-compose# docker-compose up -d alertmanager


root@k8s-master71u:/data/thanos-docker-compose# docker-compose ps
     Name                   Command                   State                                           Ports
----------------------------------------------------------------------------------------------------------------------------------------------
alertmanager     /bin/alertmanager --config ...   Up               0.0.0.0:9093->9093/tcp,:::9093->9093/tcp,
                                                                   0.0.0.0:9094->9094/tcp,:::9094->9094/tcp
minio            /usr/bin/docker-entrypoint ...   Up (unhealthy)   0.0.0.0:9000->9000/tcp,:::9000->9000/tcp,
                                                                   0.0.0.0:9001->9001/tcp,:::9001->9001/tcp
prometheus_one   /bin/prometheus --web.read ...   Up               0.0.0.0:9090->9090/tcp,:::9090->9090/tcp


root@k8s-master72u:/data/thanos-docker-compose# docker-compose ps
     Name                   Command               State                                         Ports
--------------------------------------------------------------------------------------------------------------------------------------------
alertmanager     /bin/alertmanager --config ...   Up      0.0.0.0:9093->9093/tcp,:::9093->9093/tcp, 0.0.0.0:9094->9094/tcp,:::9094->9094/tcp
prometheus_one   /bin/prometheus --web.read ...   Up      0.0.0.0:9090->9090/tcp,:::9090->9090/tcp


root@k8s-master73u:/data/thanos-docker-compose# docker-compose ps
     Name                   Command               State                                         Ports
--------------------------------------------------------------------------------------------------------------------------------------------
alertmanager     /bin/alertmanager --config ...   Up      0.0.0.0:9093->9093/tcp,:::9093->9093/tcp, 0.0.0.0:9094->9094/tcp,:::9094->9094/tcp
prometheus_one   /bin/prometheus --web.read ...   Up      0.0.0.0:9090->9090/tcp,:::9090->9090/tcp
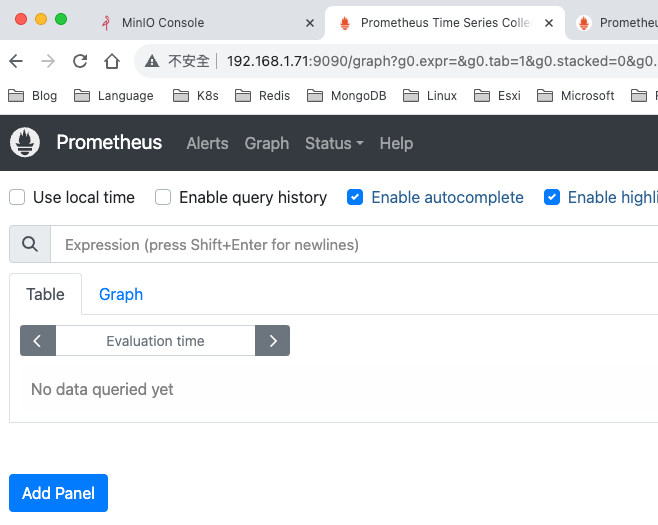
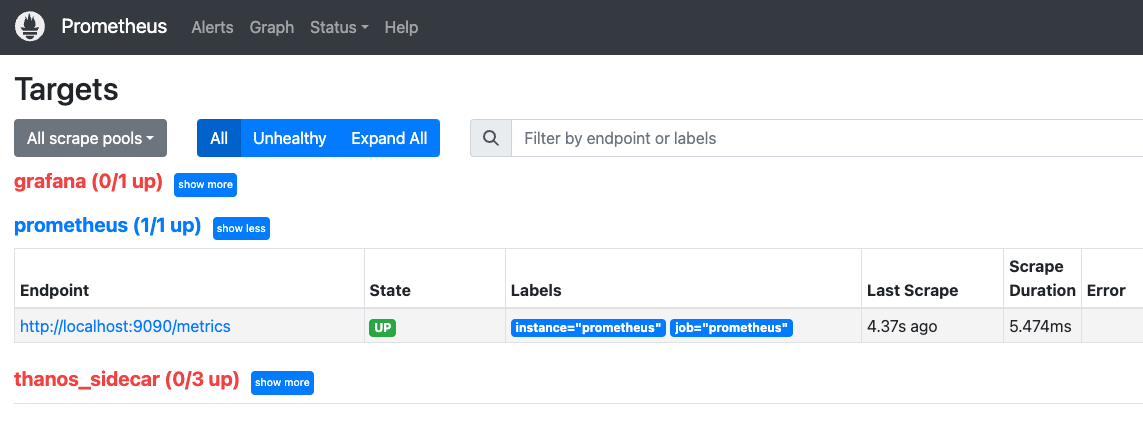
測試
http://192.168.1.71:9090/graph?g0.expr=&g0.tab=1&g0.stacked=0&g0.show_exemplars=0&g0.range_input=1h
http://192.168.1.72:9090/graph?g0.expr=&g0.tab=1&g0.stacked=0&g0.show_exemplars=0&g0.range_input=1h
http://192.168.1.73:9090/graph?g0.expr=&g0.tab=1&g0.stacked=0&g0.show_exemplars=0&g0.range_input=1h
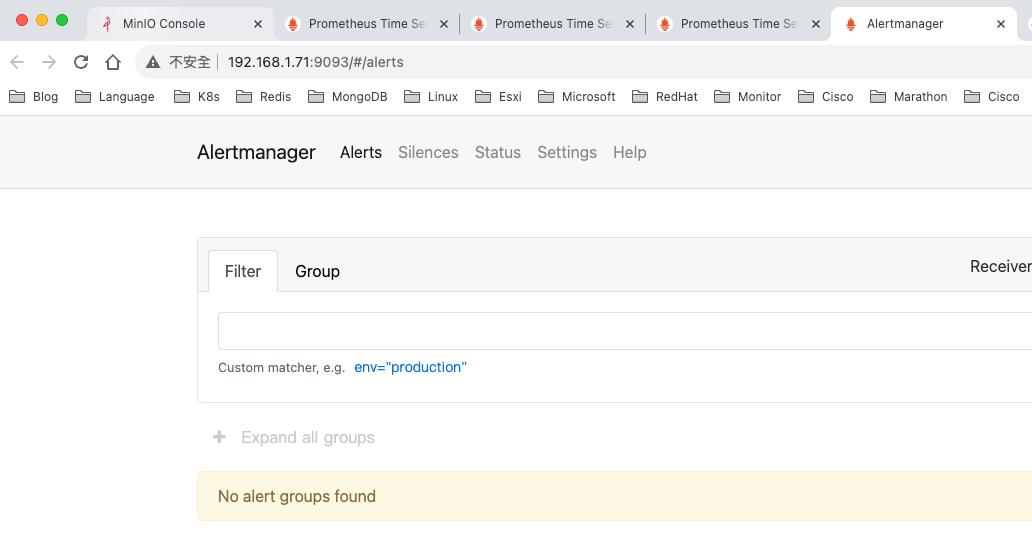
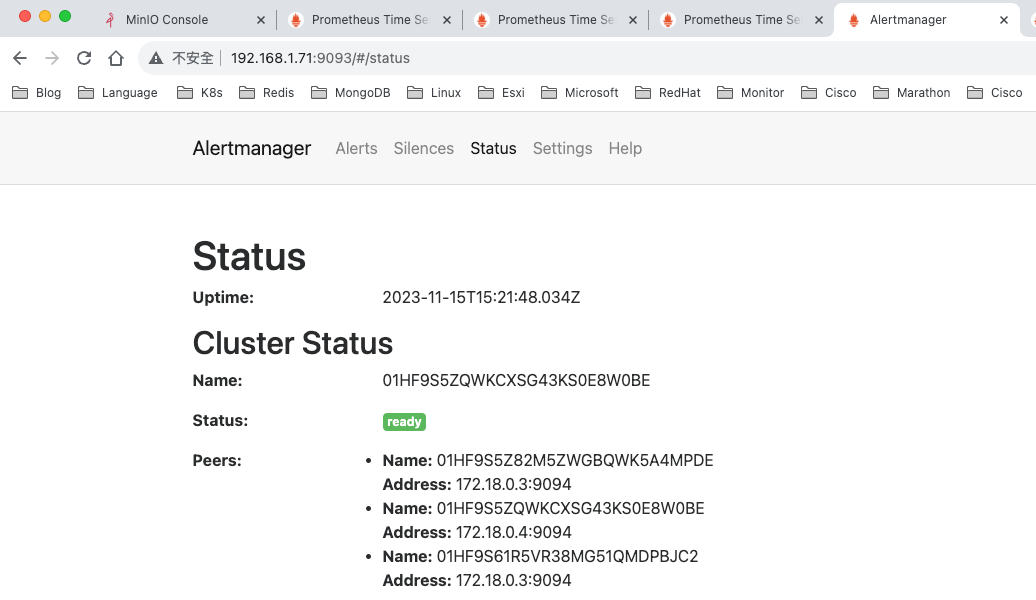
http://192.168.1.71:9093/#/alerts
http://192.168.1.72:9093/#/alerts
http://192.168.1.73:9093/#/alerts
step3 thanos_sidecar、thanos_querier、thanos_storer
主機: k8s-master71u (192.168.1.71)、k8s-master72u (192.168.1.72)、k8s-master73u (192.168.1.73)
mkdir -p ./thanos/conf
thanos bucket、query、store設定檔
# bucket只有在192.168.1.71,所以每一台的設定都一樣
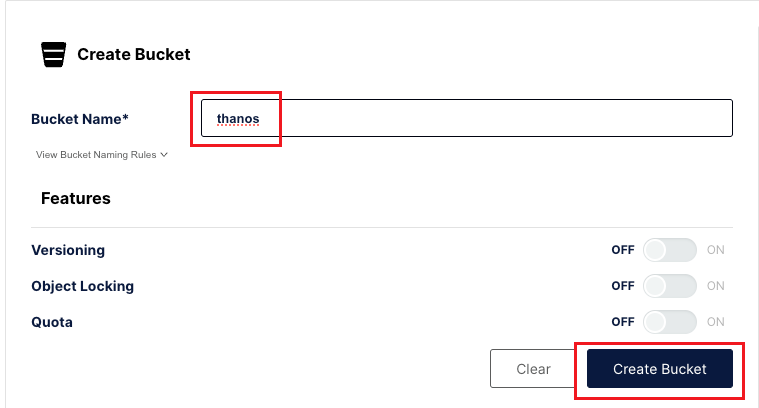
cat > ./thanos/conf/bucket_config.yaml << 'EOF'
type: S3
config:
bucket: "thanos"
endpoint: "192.168.1.71:9000"
access_key: "admin"
secret_key: "admin123456"
insecure: true
EOF
cat > ./thanos/conf/query.yaml << 'EOF'
#所有querier節點
- targets:
- 192.168.1.71:19192
- 192.168.1.72:19192
- 192.168.1.73:19192
EOF
cat > ./thanos/conf/store.yaml << 'EOF'
#所有sidecar節點和store節點
- targets:
#sidecar節點
- 192.168.1.71:19090
- 192.168.1.72:19090
- 192.168.1.73:19090
#store節點
- 192.168.1.71:29090
- 192.168.1.72:29090
- 192.168.1.73:29090
EOF
啟動thanos_sidecar、thanos_querier、thanos_storer
root@k8s-master71u:/data/thanos-docker-compose# docker-compose up -d thanos_sidecar_one
root@k8s-master72u:/data/thanos-docker-compose# docker-compose up -d thanos_sidecar_one
root@k8s-master73u:/data/thanos-docker-compose# docker-compose up -d thanos_sidecar_one

root@k8s-master71u:/data/thanos-docker-compose# docker-compose up -d thanos_querier
root@k8s-master72u:/data/thanos-docker-compose# docker-compose up -d thanos_querier
root@k8s-master73u:/data/thanos-docker-compose# docker-compose up -d thanos_querier

root@k8s-master71u:/data/thanos-docker-compose# docker-compose up -d thanos_store
root@k8s-master72u:/data/thanos-docker-compose# docker-compose up -d thanos_store
root@k8s-master73u:/data/thanos-docker-compose# docker-compose up -d thanos_store


root@k8s-master71u:/data/thanos-docker-compose# docker-compose ps
       Name                     Command                   State                                         Ports
----------------------------------------------------------------------------------------------------------------------------------------------
alertmanager         /bin/alertmanager --config ...   Up               0.0.0.0:9093->9093/tcp,:::9093->9093/tcp,
                                                                       0.0.0.0:9094->9094/tcp,:::9094->9094/tcp
minio                /usr/bin/docker-entrypoint ...   Up (unhealthy)   0.0.0.0:9000->9000/tcp,:::9000->9000/tcp,
                                                                       0.0.0.0:9001->9001/tcp,:::9001->9001/tcp
prometheus_one       /bin/prometheus --web.read ...   Up               0.0.0.0:9090->9090/tcp,:::9090->9090/tcp
thanos_querier       /bin/thanos query --http-a ...   Up               0.0.0.0:19192->19192/tcp,:::19192->19192/tcp
thanos_sidecar_one   /bin/thanos sidecar --log. ...   Up
thanos_store         /bin/thanos store --data-d ...   Up               0.0.0.0:29090->19090/tcp,:::29090->19090/tcp,
                                                                       0.0.0.0:29191->19191/tcp,:::29191->19191/tcp, 29090/tcp, 29191/tcp


root@k8s-master72u:/data/thanos-docker-compose# docker-compose ps
       Name                     Command               State                                        Ports
----------------------------------------------------------------------------------------------------------------------------------------------
alertmanager         /bin/alertmanager --config ...   Up      0.0.0.0:9093->9093/tcp,:::9093->9093/tcp,
                                                              0.0.0.0:9094->9094/tcp,:::9094->9094/tcp
prometheus_one       /bin/prometheus --web.read ...   Up      0.0.0.0:9090->9090/tcp,:::9090->9090/tcp
thanos_querier       /bin/thanos query --http-a ...   Up      0.0.0.0:19192->19192/tcp,:::19192->19192/tcp
thanos_sidecar_one   /bin/thanos sidecar --log. ...   Up
thanos_store         /bin/thanos store --data-d ...   Up      0.0.0.0:29090->19090/tcp,:::29090->19090/tcp,
                                                              0.0.0.0:29191->19191/tcp,:::29191->19191/tcp, 29090/tcp, 29191/tcp


root@k8s-master73u:/data/thanos-docker-compose# docker-compose ps
       Name                     Command               State                                        Ports
----------------------------------------------------------------------------------------------------------------------------------------------
alertmanager         /bin/alertmanager --config ...   Up      0.0.0.0:9093->9093/tcp,:::9093->9093/tcp,
                                                              0.0.0.0:9094->9094/tcp,:::9094->9094/tcp
prometheus_one       /bin/prometheus --web.read ...   Up      0.0.0.0:9090->9090/tcp,:::9090->9090/tcp
thanos_querier       /bin/thanos query --http-a ...   Up      0.0.0.0:19192->19192/tcp,:::19192->19192/tcp
thanos_sidecar_one   /bin/thanos sidecar --log. ...   Up
thanos_store         /bin/thanos store --data-d ...   Up      0.0.0.0:29090->19090/tcp,:::29090->19090/tcp,
                                                              0.0.0.0:29191->19191/tcp,:::29191->19191/tcp, 29090/tcp, 29191/tcp
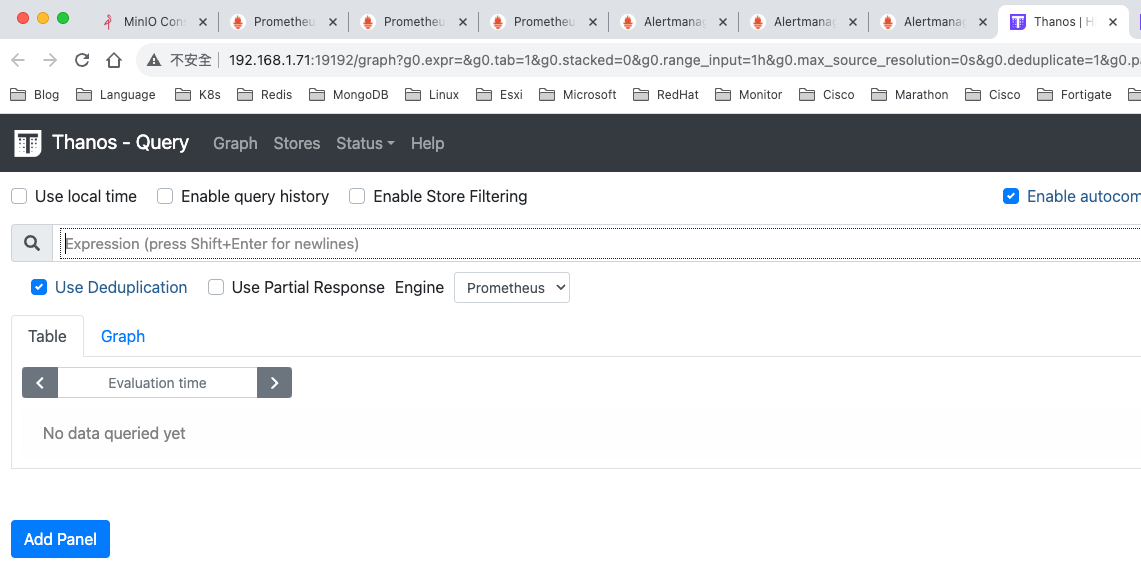
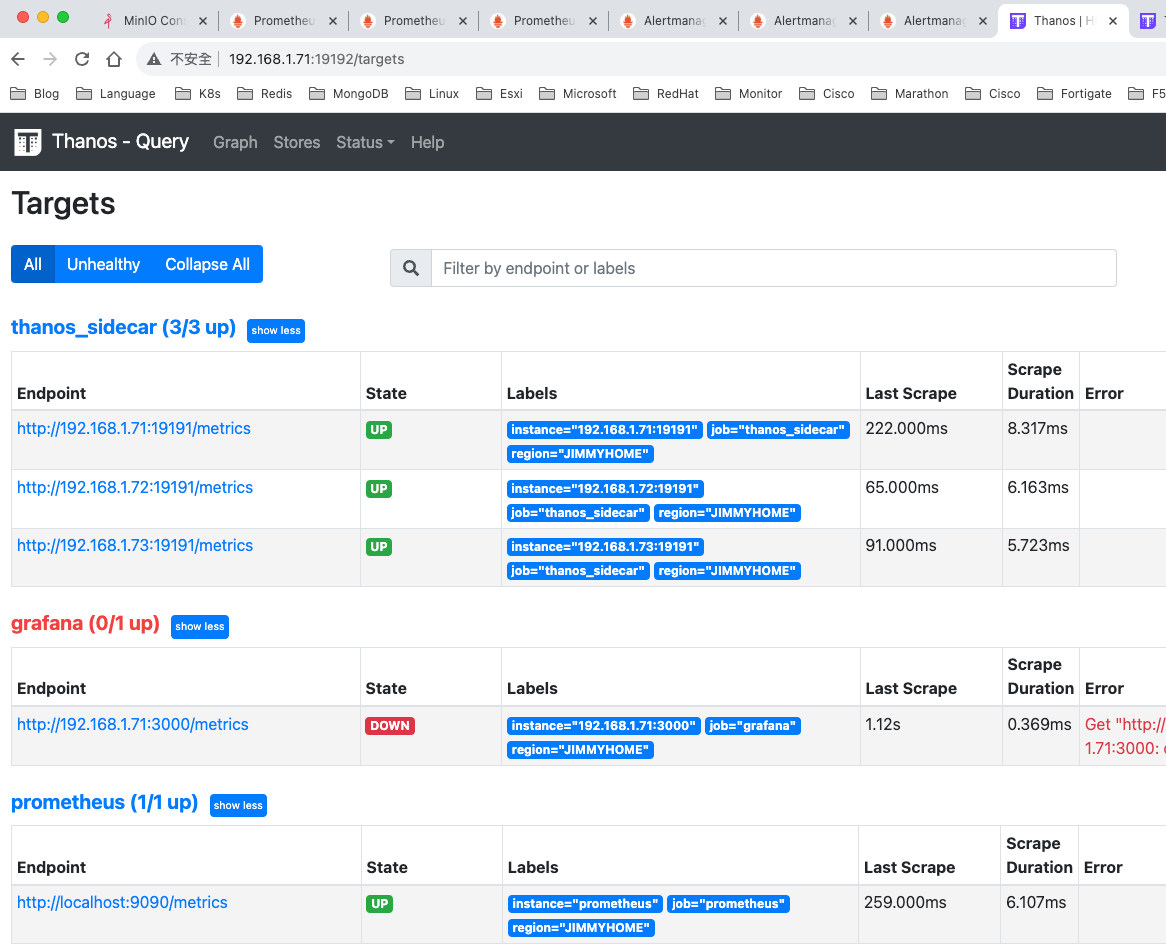
測試
http://192.168.1.71:19192/graph
http://192.168.1.72:19192/graph
http://192.168.1.73:19192/graph
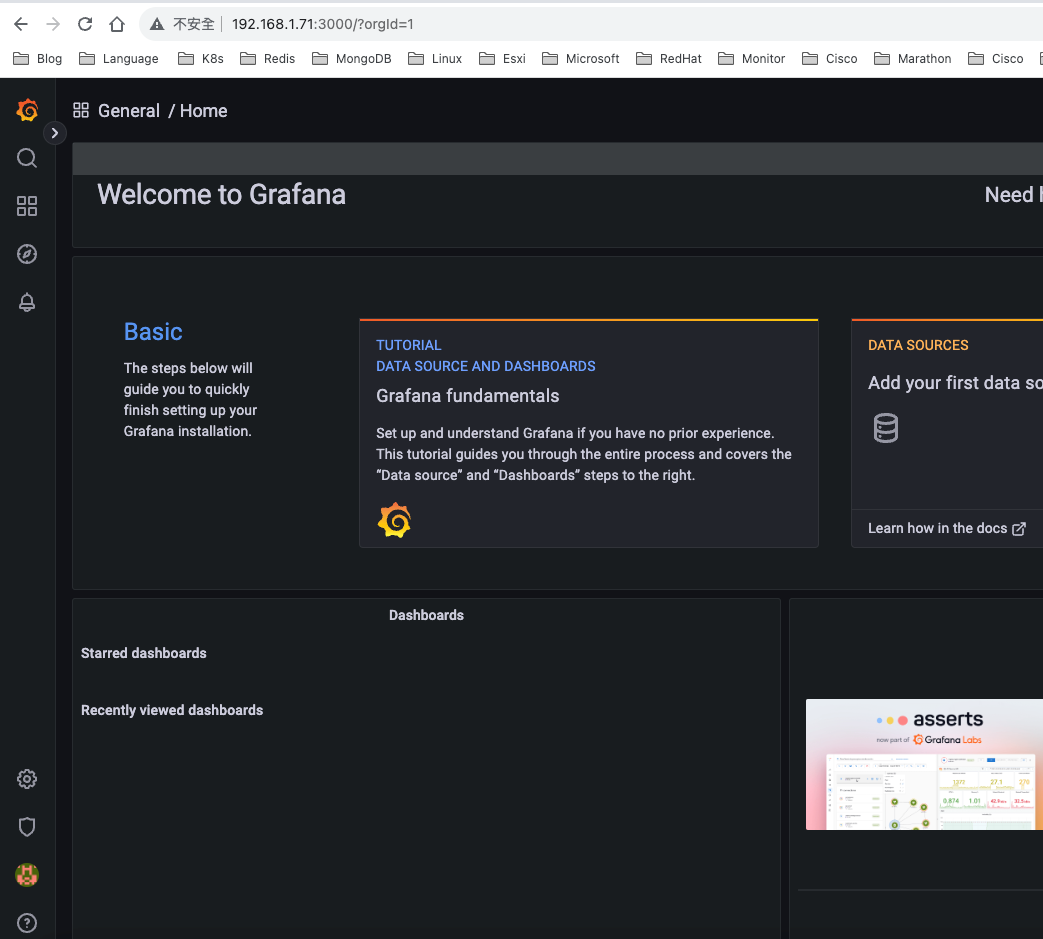
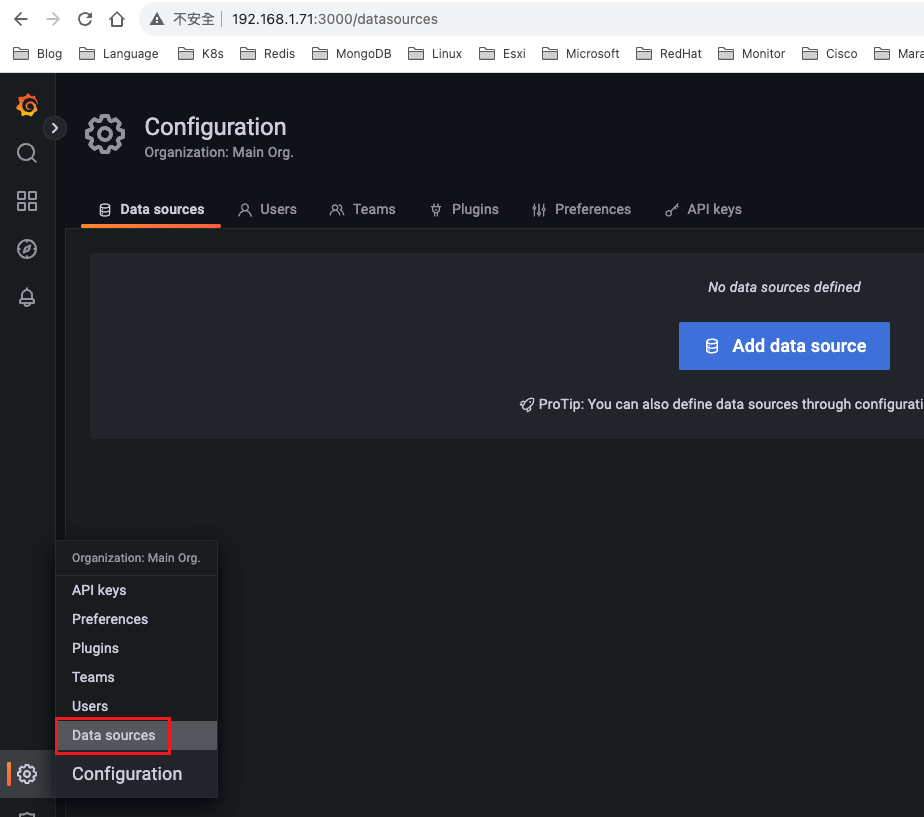
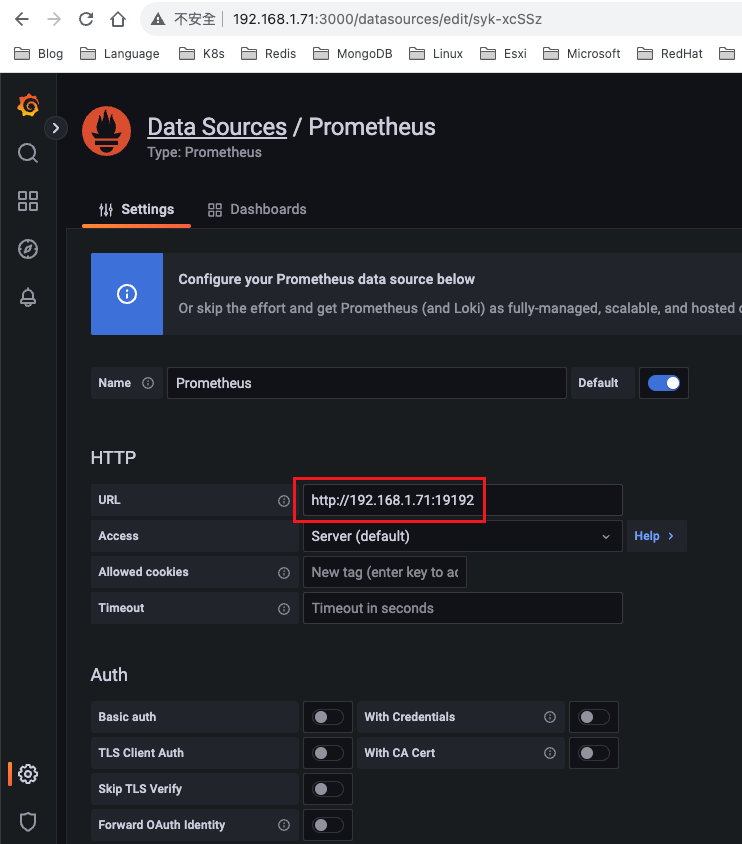
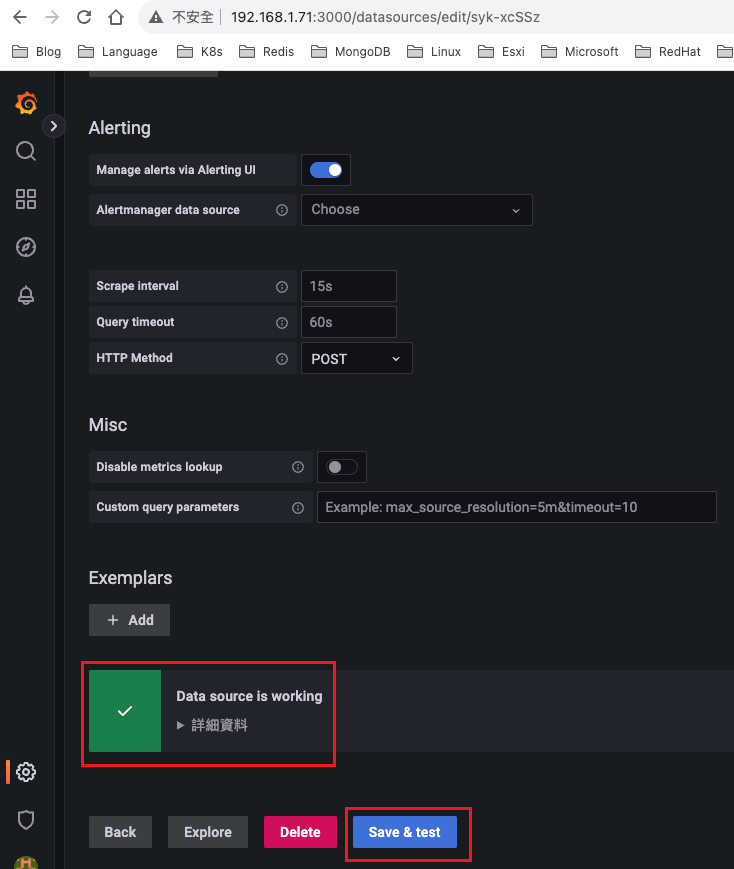
step4 grafana
主機: k8s-master71u (192.168.1.71)
mkdir -p ./grafana/data
chmod -R 777 ./grafana/data
啟動grafana
root@k8s-master71u:/data/thanos-docker-compose# docker-compose up -d grafana


root@k8s-master71u:/data/thanos-docker-compose# docker-compose ps
       Name                     Command                   State                                         Ports
----------------------------------------------------------------------------------------------------------------------------------------------
alertmanager         /bin/alertmanager --config ...   Up               0.0.0.0:9093->9093/tcp,:::9093->9093/tcp,
                                                                       0.0.0.0:9094->9094/tcp,:::9094->9094/tcp
grafana              /run.sh                          Up               0.0.0.0:3000->3000/tcp,:::3000->3000/tcp
minio                /usr/bin/docker-entrypoint ...   Up (unhealthy)   0.0.0.0:9000->9000/tcp,:::9000->9000/tcp,
                                                                       0.0.0.0:9001->9001/tcp,:::9001->9001/tcp
prometheus_one       /bin/prometheus --web.read ...   Up               0.0.0.0:9090->9090/tcp,:::9090->9090/tcp
thanos_querier       /bin/thanos query --http-a ...   Up               0.0.0.0:19192->19192/tcp,:::19192->19192/tcp
thanos_sidecar_one   /bin/thanos sidecar --log. ...   Up
thanos_store         /bin/thanos store --data-d ...   Up               0.0.0.0:29090->19090/tcp,:::29090->19090/tcp,
                                                                       0.0.0.0:29191->19191/tcp,:::29191->19191/tcp, 29090/tcp, 29191/tcp
安裝plugins
root@k8s-master71u:/data/thanos-docker-compose# docker ps | grep -i grafana
b31f88d7fc08   grafana/grafana:9.0.3       "/run.sh"                34 seconds ago      Up 30 seconds               0.0.0.0:3000->3000/tcp, :::3000->3000/tcp

root@k8s-master71u:/data/thanos-docker-compose# docker exec -ti b31f88d7fc08 sh

# 安裝plugins
/usr/share/grafana # grafana-cli plugins install grafana-clock-panel
✔ Downloaded grafana-clock-panel v2.1.3 zip successfully

Please restart Grafana after installing plugins. Refer to Grafana documentation for instructions if necessary.

/usr/share/grafana # grafana-cli plugins install grafana-simple-json-datasource
✔ Downloaded grafana-simple-json-datasource v1.4.2 zip successfully

Please restart Grafana after installing plugins. Refer to Grafana documentation for instructions if necessary.

/usr/share/grafana # grafana-cli plugins install grafana-piechart-panel
✔ Downloaded grafana-piechart-panel v1.6.4 zip successfully

Please restart Grafana after installing plugins. Refer to Grafana documentation for instructions if necessary.

/usr/share/grafana # exit
root@k8s-master71u:/data/thanos-docker-compose# docker restart b31f88d7fc08
b31f88d7fc08
root@k8s-master71u:/data/thanos-docker-compose# docker ps | grep -i grafana
b31f88d7fc08   grafana/grafana:9.0.3       "/run.sh"                2 minutes ago       Up 17 seconds               0.0.0.0:3000->3000/tcp, :::3000->3000/tcp
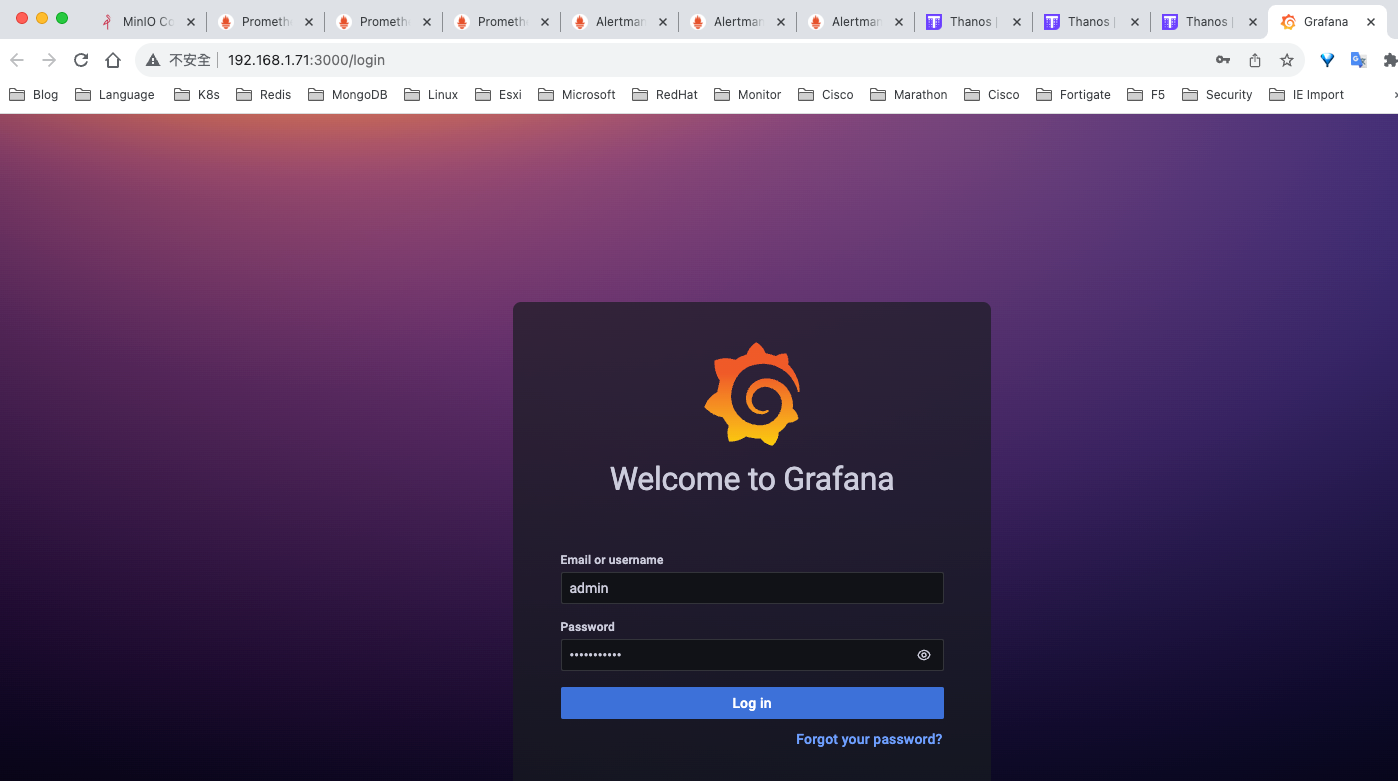
測試
http://192.168.1.71:3000/login
添加Dashboard
{
"__inputs": [
{
"name": "DS_PROMETHEUS",
"label": "Prometheus",
"description": "",
"type": "datasource",
"pluginId": "prometheus",
"pluginName": "Prometheus"
}
],
"__elements": {},
"__requires": [
{
"type": "grafana",
"id": "grafana",
"name": "Grafana",
"version": "9.0.3"
},
{
"type": "panel",
"id": "graph",
"name": "Graph (old)",
"version": ""
},
{
"type": "datasource",
"id": "prometheus",
"name": "Prometheus",
"version": "1.0.0"
},
{
"type": "panel",
"id": "table",
"name": "Table",
"version": ""
}
],
"annotations": {
"list": [
{
"builtIn": 1,
"datasource": {
"type": "datasource",
"uid": "grafana"
},
"enable": true,
"hide": true,
"iconColor": "rgba(0, 211, 255, 1)",
"name": "Annotations & Alerts",
"target": {
"limit": 100,
"matchAny": false,
"tags": [],
"type": "dashboard"
},
"type": "dashboard"
}
]
},
"description": "Redis Dashboard for Prometheus Redis Exporter 1.x",
"editable": true,
"fiscalYearStartMonth": 0,
"gnetId": 763,
"graphTooltip": 0,
"id": null,
"iteration": 1699347258536,
"links": [],
"liveNow": false,
"panels": [
{
"datasource": {
"type": "prometheus",
"uid": "${DS_PROMETHEUS}"
},
"description": "",
"fieldConfig": {
"defaults": {
"color": {
"mode": "thresholds"
},
"custom": {
"align": "center",
"displayMode": "auto",
"filterable": false,
"inspect": false
},
"mappings": [],
"thresholds": {
"mode": "absolute",
"steps": [
{
"color": "green",
"value": null
}
]
},
"unit": "none"
},
"overrides": [
{
"matcher": {
"id": "byName",
"options": "總CPU"
},
"properties": [
{
"id": "custom.width",
"value": 53
}
]
},
{
"matcher": {
"id": "byName",
"options": "總內存"
},
"properties": [
{
"id": "custom.width",
"value": 87
}
]
},
{
"matcher": {
"id": "byName",
"options": "名稱"
},
"properties": [
{
"id": "custom.width"
}
]
},
{
"matcher": {
"id": "byName",
"options": "類型"
},
"properties": [
{
"id": "custom.width",
"value": 143
}
]
},
{
"matcher": {
"id": "byName",
"options": "到期日"
},
"properties": [
{
"id": "custom.width",
"value": 70
}
]
},
{
"matcher": {
"id": "byName",
"options": "實例"
},
"properties": [
{
"id": "custom.width",
"value": 154
}
]
},
{
"matcher": {
"id": "byRegexp",
"options": "/總.*/"
},
"properties": [
{
"id": "custom.displayMode",
"value": "color-background"
},
{
"id": "color",
"value": {
"fixedColor": "blue",
"mode": "fixed"
}
}
]
},
{
"matcher": {
"id": "byRegexp",
"options": "/.*%/"
},
"properties": [
{
"id": "unit",
"value": "percent"
},
{
"id": "min",
"value": 0
},
{
"id": "max",
"value": 100
},
{
"id": "color",
"value": {
"mode": "continuous-GrYlRd"
}
},
{
"id": "custom.displayMode",
"value": "gradient-gauge"
}
]
},
{
"matcher": {
"id": "byName",
"options": "CPU%"
},
"properties": [
{
"id": "custom.width",
"value": 98
},
{
"id": "unit",
"value": "percent"
},
{
"id": "color",
"value": {
"mode": "continuous-GrYlRd"
}
},
{
"id": "custom.displayMode",
"value": "gradient-gauge"
},
{
"id": "max",
"value": 100
}
]
},
{
"matcher": {
"id": "byName",
"options": "内存%"
},
"properties": [
{
"id": "custom.width",
"value": 100
}
]
},
{
"matcher": {
"id": "byName",
"options": "連接數"
},
"properties": [
{
"id": "custom.width",
"value": 117
},
{
"id": "thresholds",
"value": {
"mode": "absolute",
"steps": [
{
"color": "green",
"value": null
},
{
"color": "#EAB839",
"value": 1000
},
{
"color": "red",
"value": 2000
}
]
}
},
{
"id": "custom.displayMode",
"value": "color-background"
}
]
},
{
"matcher": {
"id": "byName",
"options": "版本"
},
"properties": [
{
"id": "custom.width",
"value": 23
}
]
},
{
"matcher": {
"id": "byName",
"options": "操作数/s"
},
"properties": [
{
"id": "custom.width",
"value": 85
},
{
"id": "custom.displayMode",
"value": "color-background"
},
{
"id": "thresholds",
"value": {
"mode": "absolute",
"steps": [
{
"color": "green",
"value": null
},
{
"color": "#EAB839",
"value": 3000
},
{
"color": "red",
"value": 4000
}
]
}
}
]
},
{
"matcher": {
"id": "byName",
"options": "啟動"
},
"properties": [
{
"id": "unit",
"value": "s"
},
{
"id": "custom.width",
"value": 119
}
]
},
{
"matcher": {
"id": "byName",
"options": "實例ID"
},
"properties": [
{
"id": "custom.width"
}
]
},
{
"matcher": {
"id": "byName",
"options": "命中率"
},
"properties": [
{
"id": "custom.width",
"value": 163
},
{
"id": "unit",
"value": "percentunit"
},
{
"id": "color",
"value": {
"mode": "continuous-RdYlGr"
}
},
{
"id": "custom.displayMode",
"value": "gradient-gauge"
},
{
"id": "max",
"value": 1
}
]
},
{
"matcher": {
"id": "byName",
"options": "總Keys"
},
"properties": [
{
"id": "custom.width",
"value": 94
}
]
},
{
"matcher": {
"id": "byName",
"options": "流入"
},
"properties": [
{
"id": "custom.width",
"value": 101
},
{
"id": "unit",
"value": "binBps"
},
{
"id": "thresholds",
"value": {
"mode": "absolute",
"steps": [
{
"color": "green",
"value": null
},
{
"color": "#EAB839",
"value": 3000000
},
{
"color": "red",
"value": 10000000
}
]
}
},
{
"id": "custom.displayMode",
"value": "color-background"
}
]
},
{
"matcher": {
"id": "byName",
"options": "流出"
},
"properties": [
{
"id": "custom.width",
"value": 103
},
{
"id": "unit",
"value": "binBps"
},
{
"id": "custom.displayMode",
"value": "color-background"
},
{
"id": "thresholds",
"value": {
"mode": "absolute",
"steps": [
{
"color": "green",
"value": null
},
{
"color": "#EAB839",
"value": 3000000
},
{
"color": "red",
"value": 10000000
}
]
}
}
]
},
{
"matcher": {
"id": "byName",
"options": "操作數/s"
},
"properties": [
{
"id": "custom.width",
"value": 110
},
{
"id": "thresholds",
"value": {
"mode": "absolute",
"steps": [
{
"color": "green",
"value": null
},
{
"color": "#EAB839",
"value": 15000
},
{
"color": "red",
"value": 20000
}
]
}
},
{
"id": "custom.displayMode",
"value": "color-background"
}
]
},
{
"matcher": {
"id": "byName",
"options": "env"
},
"properties": [
{
"id": "custom.width",
"value": 122
}
]
},
{
"matcher": {
"id": "byName",
"options": "內存%"
},
"properties": [
{
"id": "custom.width",
"value": 172
}
]
},
{
"matcher": {
"id": "byName",
"options": "主機"
},
"properties": [
{
"id": "custom.width",
"value": 203
}
]
},
{
"matcher": {
"id": "byName",
"options": "function"
},
"properties": [
{
"id": "custom.width",
"value": 142
}
]
},
{
"matcher": {
"id": "byName",
"options": "記憶體%"
},
"properties": [
{
"id": "custom.width",
"value": 176
},
{
"id": "unit",
"value": "percent"
},
{
"id": "color",
"value": {
"mode": "continuous-GrYlRd"
}
},
{
"id": "custom.displayMode",
"value": "gradient-gauge"
},
{
"id": "max",
"value": 100
}
]
},
{
"matcher": {
"id": "byName",
"options": "慢日誌"
},
"properties": [
{
"id": "custom.width",
"value": 113
},
{
"id": "thresholds",
"value": {
"mode": "absolute",
"steps": [
{
"color": "green",
"value": null
},
{
"color": "#EAB839",
"value": 2
},
{
"color": "red",
"value": 5
}
]
}
},
{
"id": "custom.displayMode",
"value": "color-background"
}
]
}
]
},
"gridPos": {
"h": 14,
"w": 24,
"x": 0,
"y": 0
},
"id": 40,
"options": {
"footer": {
"fields": [
"Value #B",
"Value #C",
"Value #L",
"Value #H",
"Value #I",
"Value #M",
"Value #N",
"Value #J",
"Value #K"
],
"reducer": [
"sum"
],
"show": false
},
"showHeader": true,
"sortBy": [
{
"desc": true,
"displayName": "CPU%"
}
]
},
"pluginVersion": "9.0.3",
"targets": [
{
"datasource": {
"type": "prometheus",
"uid": "${DS_PROMETHEUS}"
},
"editorMode": "code",
"exemplar": false,
"expr": "redis_up{env=~\"$env\",function=~\"$function\"}",
"format": "table",
"hide": false,
"instant": true,
"interval": "",
"legendFormat": "__auto",
"refId": "A"
},
{
"datasource": {
"type": "prometheus",
"uid": "${DS_PROMETHEUS}"
},
"editorMode": "code",
"exemplar": false,
"expr": "sum(redis_connected_clients{env=~\"$env\",function=~\"$function\"})by(instance)",
"format": "table",
"hide": false,
"instant": true,
"interval": "",
"legendFormat": "__auto",
"refId": "D"
},
{
"datasource": {
"type": "prometheus",
"uid": "${DS_PROMETHEUS}"
},
"editorMode": "code",
"exemplar": false,
"expr": "sum(irate(redis_commands_total{env=~\"$env\",function=~\"$function\"} [2m]))by(instance)",
"format": "table",
"hide": false,
"instant": true,
"interval": "",
"legendFormat": "__auto",
"refId": "E"
},
{
"datasource": {
"type": "prometheus",
"uid": "${DS_PROMETHEUS}"
},
"editorMode": "code",
"exemplar": false,
"expr": "redis_uptime_in_seconds{env=~\"$env\",function=~\"$function\"} - 0",
"format": "table",
"hide": false,
"instant": true,
"interval": "",
"legendFormat": "__auto",
"refId": "F"
},
{
"datasource": {
"type": "prometheus",
"uid": "${DS_PROMETHEUS}"
},
"editorMode": "code",
"exemplar": false,
"expr": "avg(irate(redis_keyspace_hits_total{env=~\"$env\",function=~\"$function\"}[2m]) / (irate(redis_keyspace_misses_total{env=~\"$env\",function=~\"$function\"}[1m]) + irate(redis_keyspace_hits_total{env=~\"$env\",function=~\"$function\"}[2m]))) by (instance)",
"format": "table",
"hide": false,
"instant": true,
"interval": "",
"legendFormat": "__auto",
"refId": "G"
},
{
"datasource": {
"type": "prometheus",
"uid": "${DS_PROMETHEUS}"
},
"editorMode": "code",
"exemplar": false,
"expr": "sum (redis_db_keys{env=~\"$env\",function=~\"$function\"}) by (instance)",
"format": "table",
"hide": false,
"instant": true,
"interval": "",
"legendFormat": "__auto",
"refId": "H"
},
{
"datasource": {
"type": "prometheus",
"uid": "${DS_PROMETHEUS}"
},
"editorMode": "code",
"exemplar": false,
"expr": "sum(irate(redis_net_input_bytes_total{env=~\"$env\",function=~\"$function\"}[2m])) by (instance)",
"format": "table",
"hide": false,
"instant": true,
"interval": "",
"legendFormat": "__auto",
"refId": "I"
},
{
"datasource": {
"type": "prometheus",
"uid": "${DS_PROMETHEUS}"
},
"editorMode": "code",
"exemplar": false,
"expr": "sum(irate(redis_net_output_bytes_total{env=~\"$env\",function=~\"$function\"}[2m])) by (instance)",
"format": "table",
"hide": false,
"instant": true,
"interval": "",
"legendFormat": "__auto",
"refId": "J"
},
{
"datasource": {
"type": "prometheus",
"uid": "${DS_PROMETHEUS}"
},
"editorMode": "code",
"exemplar": false,
"expr": "(100 * (redis_memory_used_bytes{env=~\"$env\",function=~\"$function\"} / redis_memory_max_bytes{env=~\"$env\",function=~\"$function\"}))",
"format": "table",
"hide": false,
"instant": true,
"interval": "",
"legendFormat": "__auto",
"refId": "B"
},
{
"datasource": {
"type": "prometheus",
"uid": "${DS_PROMETHEUS}"
},
"editorMode": "code",
"exemplar": false,
"expr": "irate(redis_cpu_sys_seconds_total{env=~\"$env\",function=~\"$function\"}[2s])*100",
"format": "table",
"hide": false,
"instant": true,
"interval": "",
"legendFormat": "__auto",
"refId": "C"
},
{
"datasource": {
"type": "prometheus",
"uid": "${DS_PROMETHEUS}"
},
"editorMode": "code",
"exemplar": false,
"expr": "sum(redis_slowlog_length{env=~\"$env\",function=~\"$function\"}) by (instance)",
"format": "table",
"hide": false,
"instant": true,
"interval": "",
"legendFormat": "__auto",
"refId": "K"
}
],
"title": "REDIS資源總覽表【$env:$function】",
"transformations": [
{
"id": "merge",
"options": {}
},
{
"id": "organize",
"options": {
"excludeByName": {
"Time": true,
"Value": true,
"Value #A": true,
"__name__": true,
"account": true,
"env": false,
"function": false,
"group": true,
"iaccount": true,
"igroup": true,
"iname": true,
"instance": false,
"job": true,
"origin_prometheus": true,
"region": true,
"vendor": true
},
"indexByName": {
"Time": 0,
"Value #A": 16,
"Value #B": 6,
"Value #C": 5,
"Value #D": 8,
"Value #E": 9,
"Value #F": 13,
"Value #G": 7,
"Value #H": 12,
"Value #I": 10,
"Value #J": 11,
"Value #K": 14,
"__name__": 1,
"env": 4,
"function": 3,
"instance": 2,
"job": 15
},
"renameByName": {
"Value #B": "記憶體%",
"Value #C": "CPU%",
"Value #D": "連接數",
"Value #E": "操作數/s",
"Value #F": "啟動",
"Value #G": "命中率",
"Value #H": "總Keys",
"Value #I": "流入",
"Value #J": "流出",
"Value #K": "慢日誌",
"account": "賬號",
"cpu": "總CPU",
"disk": "總磁盤",
"exp": "到期日",
"group": "分組",
"iaccount": "",
"iid": "實例ID",
"instance": "主機",
"itype": "類型",
"mem": "總內存",
"name": "名稱",
"region": "",
"vendor": "",
"ver": "版本"
}
}
}
],
"type": "table"
},
{
"aliasColors": {},
"bars": false,
"dashLength": 10,
"dashes": false,
"datasource": {
"type": "prometheus",
"uid": "${DS_PROMETHEUS}"
},
"editable": true,
"error": false,
"fill": 1,
"fillGradient": 0,
"grid": {},
"gridPos": {
"h": 10,
"w": 12,
"x": 0,
"y": 14
},
"hiddenSeries": false,
"id": 2,
"isNew": true,
"legend": {
"alignAsTable": true,
"avg": false,
"current": true,
"max": true,
"min": false,
"rightSide": true,
"show": true,
"sort": "max",
"sortDesc": true,
"total": false,
"values": true
},
"lines": true,
"linewidth": 2,
"links": [],
"nullPointMode": "connected",
"options": {
"alertThreshold": true
},
"percentage": false,
"pluginVersion": "9.0.3",
"pointradius": 5,
"points": false,
"renderer": "flot",
"seriesOverrides": [],
"spaceLength": 10,
"stack": false,
"steppedLine": false,
"targets": [
{
"datasource": {
"type": "prometheus",
"uid": "${DS_PROMETHEUS}"
},
"exemplar": true,
"expr": "irate(redis_commands_processed_total{env=~\"$env\",function=~\"$function\",instance=~\"$instance\"}[2s])",
"format": "time_series",
"interval": "",
"intervalFactor": 2,
"legendFormat": "{{ instance }}",
"metric": "A",
"refId": "A",
"step": 240,
"target": ""
}
],
"thresholds": [],
"timeRegions": [],
"title": "每秒操作數(總和)",
"tooltip": {
"msResolution": false,
"shared": true,
"sort": 0,
"value_type": "cumulative"
},
"type": "graph",
"xaxis": {
"mode": "time",
"show": true,
"values": []
},
"yaxes": [
{
"$$hashKey": "object:489",
"format": "short",
"logBase": 1,
"show": true
},
{
"$$hashKey": "object:490",
"format": "short",
"logBase": 1,
"show": true
}
],
"yaxis": {
"align": false
}
},
{
"aliasColors": {},
"bars": false,
"dashLength": 10,
"dashes": false,
"datasource": {
"type": "prometheus",
"uid": "${DS_PROMETHEUS}"
},
"decimals": 0,
"description": "Total Commands / sec",
"editable": true,
"error": false,
"fieldConfig": {
"defaults": {
"links": []
},
"overrides": []
},
"fill": 1,
"fillGradient": 0,
"grid": {},
"gridPos": {
"h": 10,
"w": 12,
"x": 12,
"y": 14
},
"hiddenSeries": false,
"id": 38,
"isNew": true,
"legend": {
"alignAsTable": true,
"avg": false,
"current": true,
"hideEmpty": true,
"hideZero": true,
"max": true,
"min": false,
"rightSide": true,
"show": true,
"sort": "max",
"sortDesc": true,
"total": false,
"values": true
},
"lines": true,
"linewidth": 1,
"links": [],
"nullPointMode": "null as zero",
"options": {
"alertThreshold": true
},
"percentage": false,
"pluginVersion": "9.0.3",
"pointradius": 5,
"points": false,
"renderer": "flot",
"seriesOverrides": [],
"spaceLength": 10,
"stack": false,
"steppedLine": false,
"targets": [
{
"datasource": {
"type": "prometheus",
"uid": "${DS_PROMETHEUS}"
},
"editorMode": "code",
"expr": "sum(irate(redis_commands_total{env=~\"$env\",function=~\"$function\",instance=~\"$instance\"} [2s])) by (cmd) >1",
"format": "time_series",
"interval": "",
"intervalFactor": 1,
"legendFormat": "{{ cmd }}",
"metric": "redis_command_calls_total",
"range": true,
"refId": "A",
"step": 240
}
],
"thresholds": [],
"timeRegions": [],
"title": "每秒操作數(命令)",
"tooltip": {
"msResolution": true,
"shared": true,
"sort": 2,
"value_type": "individual"
},
"type": "graph",
"xaxis": {
"mode": "time",
"show": true,
"values": []
},
"yaxes": [
{
"$$hashKey": "object:706",
"format": "none",
"logBase": 1,
"show": true
},
{
"$$hashKey": "object:707",
"format": "short",
"logBase": 1,
"show": true
}
],
"yaxis": {
"align": false
}
},
{
"aliasColors": {},
"bars": false,
"dashLength": 10,
"dashes": false,
"datasource": {
"type": "prometheus",
"uid": "${DS_PROMETHEUS}"
},
"editable": true,
"error": false,
"fill": 7,
"fillGradient": 0,
"grid": {},
"gridPos": {
"h": 10,
"w": 12,
"x": 0,
"y": 24
},
"hiddenSeries": false,
"id": 18,
"isNew": true,
"legend": {
"alignAsTable": true,
"avg": false,
"current": true,
"max": false,
"min": false,
"rightSide": true,
"show": true,
"total": false,
"values": true
},
"lines": true,
"linewidth": 2,
"links": [],
"nullPointMode": "connected",
"options": {
"alertThreshold": true
},
"percentage": false,
"pluginVersion": "9.0.3",
"pointradius": 5,
"points": false,
"renderer": "flot",
"seriesOverrides": [],
"spaceLength": 10,
"stack": true,
"steppedLine": false,
"targets": [
{
"datasource": {
"type": "prometheus",
"uid": "${DS_PROMETHEUS}"
},
"editorMode": "code",
"exemplar": true,
"expr": "sum (redis_db_keys{env=~\"$env\",function=~\"$function\",instance=~\"$instance\"}) by (instance)",
"format": "time_series",
"interval": "",
"intervalFactor": 2,
"legendFormat": "sum.key: {{ instance }}",
"range": true,
"refId": "A",
"step": 240,
"target": ""
}
],
"thresholds": [],
"timeRegions": [],
"title": "Key總數",
"tooltip": {
"msResolution": false,
"shared": true,
"sort": 0,
"value_type": "individual"
},
"type": "graph",
"xaxis": {
"mode": "time",
"show": true,
"values": []
},
"yaxes": [
{
"$$hashKey": "object:388",
"format": "none",
"logBase": 1,
"show": true
},
{
"$$hashKey": "object:389",
"format": "short",
"logBase": 1,
"show": true
}
],
"yaxis": {
"align": false
}
},
{
"aliasColors": {},
"bars": false,
"dashLength": 10,
"dashes": false,
"datasource": {
"type": "prometheus",
"uid": "${DS_PROMETHEUS}"
},
"editable": true,
"error": false,
"fill": 7,
"fillGradient": 0,
"grid": {},
"gridPos": {
"h": 10,
"w": 12,
"x": 12,
"y": 24
},
"hiddenSeries": false,
"id": 5,
"isNew": true,
"legend": {
"alignAsTable": true,
"avg": false,
"current": true,
"max": false,
"min": false,
"rightSide": true,
"show": true,
"total": false,
"values": true
},
"lines": true,
"linewidth": 2,
"links": [],
"nullPointMode": "connected",
"options": {
"alertThreshold": true
},
"percentage": false,
"pluginVersion": "9.0.3",
"pointradius": 5,
"points": false,
"renderer": "flot",
"seriesOverrides": [],
"spaceLength": 10,
"stack": true,
"steppedLine": false,
"targets": [
{
"datasource": {
"type": "prometheus",
"uid": "${DS_PROMETHEUS}"
},
"editorMode": "code",
"expr": "sum (redis_db_keys{env=~\"$env\",function=~\"$function\",instance=~\"$instance\"}) by (db)",
"format": "time_series",
"interval": "",
"intervalFactor": 2,
"legendFormat": "{{ db }} ",
"range": true,
"refId": "A",
"step": 240,
"target": ""
}
],
"thresholds": [],
"timeRegions": [],
"title": "各DB KEY分布",
"tooltip": {
"msResolution": false,
"shared": true,
"sort": 0,
"value_type": "individual"
},
"type": "graph",
"xaxis": {
"mode": "time",
"show": true,
"values": []
},
"yaxes": [
{
"$$hashKey": "object:558",
"format": "none",
"logBase": 1,
"show": true
},
{
"$$hashKey": "object:559",
"format": "short",
"logBase": 1,
"show": true
}
],
"yaxis": {
"align": false
}
},
{
"aliasColors": {
"max": "#BF1B00"
},
"bars": false,
"dashLength": 10,
"dashes": false,
"datasource": {
"type": "prometheus",
"uid": "${DS_PROMETHEUS}"
},
"editable": true,
"error": false,
"fill": 1,
"fillGradient": 0,
"grid": {},
"gridPos": {
"h": 10,
"w": 12,
"x": 0,
"y": 34
},
"hiddenSeries": false,
"id": 7,
"isNew": true,
"legend": {
"alignAsTable": true,
"avg": false,
"current": true,
"hideEmpty": false,
"hideZero": false,
"max": false,
"min": false,
"rightSide": true,
"show": true,
"total": false,
"values": true
},
"lines": true,
"linewidth": 2,
"links": [],
"nullPointMode": "null as zero",
"options": {
"alertThreshold": true
},
"percentage": false,
"pluginVersion": "9.0.3",
"pointradius": 5,
"points": false,
"renderer": "flot",
"seriesOverrides": [],
"spaceLength": 10,
"stack": false,
"steppedLine": false,
"targets": [
{
"datasource": {
"type": "prometheus",
"uid": "${DS_PROMETHEUS}"
},
"editorMode": "code",
"exemplar": true,
"expr": "redis_memory_used_bytes{env=~\"$env\",function=~\"$function\",instance=~\"$instance\"} ",
"format": "time_series",
"interval": "",
"intervalFactor": 2,
"legendFormat": "used: {{ instance }}",
"metric": "",
"range": true,
"refId": "A",
"step": 240,
"target": ""
},
{
"datasource": {
"type": "prometheus",
"uid": "${DS_PROMETHEUS}"
},
"editorMode": "code",
"expr": "redis_memory_max_bytes{env=~\"$env\",function=~\"$function\",instance=~\"$instance\"} ",
"format": "time_series",
"hide": false,
"intervalFactor": 2,
"legendFormat": "max: {{ instance }}",
"range": true,
"refId": "B",
"step": 240
}
],
"thresholds": [],
"timeRegions": [],
"title": "記憶體使用量",
"tooltip": {
"msResolution": false,
"shared": true,
"sort": 0,
"value_type": "cumulative"
},
"type": "graph",
"xaxis": {
"mode": "time",
"show": true,
"values": []
},
"yaxes": [
{
"$$hashKey": "object:433",
"format": "bytes",
"logBase": 1,
"min": 0,
"show": true
},
{
"$$hashKey": "object:434",
"format": "short",
"logBase": 1,
"show": true
}
],
"yaxis": {
"align": false
}
},
{
"aliasColors": {},
"bars": false,
"dashLength": 10,
"dashes": false,
"datasource": {
"type": "prometheus",
"uid": "${DS_PROMETHEUS}"
},
"description": "",
"editable": true,
"error": false,
"fill": 1,
"fillGradient": 0,
"grid": {},
"gridPos": {
"h": 10,
"w": 12,
"x": 12,
"y": 34
},
"hiddenSeries": false,
"id": 20,
"isNew": true,
"legend": {
"alignAsTable": true,
"avg": false,
"current": true,
"max": true,
"min": false,
"rightSide": true,
"show": true,
"sort": "max",
"sortDesc": true,
"total": false,
"values": true
},
"lines": true,
"linewidth": 2,
"links": [],
"nullPointMode": "connected",
"options": {
"alertThreshold": true
},
"percentage": false,
"pluginVersion": "9.0.3",
"pointradius": 5,
"points": false,
"renderer": "flot",
"seriesOverrides": [],
"spaceLength": 10,
"stack": false,
"steppedLine": false,
"targets": [
{
"datasource": {
"type": "prometheus",
"uid": "${DS_PROMETHEUS}"
},
"editorMode": "code",
"exemplar": true,
"expr": "irate(redis_cpu_sys_seconds_total{env=~\"$env\",function=~\"$function\",instance=~\"$instance\"}[2s])*100",
"format": "time_series",
"hide": false,
"interval": "",
"intervalFactor": 2,
"legendFormat": "sys: {{ instance }}",
"range": true,
"refId": "A",
"step": 240
},
{
"datasource": {
"type": "prometheus",
"uid": "${DS_PROMETHEUS}"
},
"editorMode": "code",
"exemplar": true,
"expr": "irate(redis_cpu_user_seconds_total{instance=~\"$instance\"}[2s])*100",
"format": "time_series",
"hide": true,
"interval": "",
"intervalFactor": 2,
"legendFormat": "user: {{ instance }}",
"range": true,
"refId": "B",
"step": 240
}
],
"thresholds": [],
"timeRegions": [],
"title": "CPU使用率",
"tooltip": {
"msResolution": true,
"shared": true,
"sort": 0,
"value_type": "cumulative"
},
"type": "graph",
"xaxis": {
"mode": "time",
"show": true,
"values": []
},
"yaxes": [
{
"$$hashKey": "object:377",
"format": "percent",
"logBase": 1,
"show": true
},
{
"$$hashKey": "object:378",
"format": "short",
"logBase": 1,
"show": true
}
],
"yaxis": {
"align": false
}
},
{
"aliasColors": {
"evicts": "#890F02",
"memcached_items_evicted_total{instance=\"172.17.0.1:9150\",job=\"prometheus\"}": "#890F02",
"reclaims": "#3F6833"
},
"bars": false,
"dashLength": 10,
"dashes": false,
"datasource": {
"type": "prometheus",
"uid": "${DS_PROMETHEUS}"
},
"editable": true,
"error": false,
"fill": 1,
"fillGradient": 0,
"grid": {},
"gridPos": {
"h": 10,
"w": 12,
"x": 0,
"y": 44
},
"hiddenSeries": false,
"id": 16,
"isNew": true,
"legend": {
"alignAsTable": true,
"avg": false,
"current": true,
"max": true,
"min": false,
"rightSide": true,
"show": true,
"sort": "current",
"sortDesc": true,
"total": false,
"values": true
},
"lines": true,
"linewidth": 2,
"links": [],
"nullPointMode": "connected",
"options": {
"alertThreshold": true
},
"percentage": false,
"pluginVersion": "9.0.3",
"pointradius": 5,
"points": false,
"renderer": "flot",
"seriesOverrides": [
{
"$$hashKey": "object:251",
"alias": "reclaims",
"yaxis": 2
}
],
"spaceLength": 10,
"stack": false,
"steppedLine": false,
"targets": [
{
"datasource": {
"type": "prometheus",
"uid": "${DS_PROMETHEUS}"
},
"editorMode": "code",
"exemplar": true,
"expr": "redis_slowlog_length{env=~\"$env\",function=~\"$function\",instance=~\"$instance\"}",
"hide": false,
"interval": "",
"legendFormat": "redis_slowlog: {{ instance }}",
"range": true,
"refId": "A"
}
],
"thresholds": [],
"timeRegions": [],
"title": "慢日誌",
"tooltip": {
"msResolution": false,
"shared": true,
"sort": 0,
"value_type": "cumulative"
},
"type": "graph",
"xaxis": {
"mode": "time",
"show": true,
"values": []
},
"yaxes": [
{
"$$hashKey": "object:258",
"format": "short",
"logBase": 1,
"show": true
},
{
"$$hashKey": "object:259",
"format": "short",
"logBase": 1,
"show": true
}
],
"yaxis": {
"align": false
}
},
{
"aliasColors": {},
"bars": false,
"dashLength": 10,
"dashes": false,
"datasource": {
"type": "prometheus",
"uid": "${DS_PROMETHEUS}"
},
"description": "Connected/Blocked Clients",
"fieldConfig": {
"defaults": {
"links": []
},
"overrides": []
},
"fill": 0,
"fillGradient": 0,
"gridPos": {
"h": 10,
"w": 12,
"x": 12,
"y": 44
},
"hiddenSeries": false,
"id": 42,
"legend": {
"alignAsTable": true,
"avg": false,
"current": true,
"max": true,
"min": false,
"rightSide": true,
"show": true,
"total": false,
"values": true
},
"lines": true,
"linewidth": 1,
"links": [],
"nullPointMode": "null",
"options": {
"alertThreshold": true
},
"percentage": false,
"pluginVersion": "9.0.3",
"pointradius": 2,
"points": false,
"renderer": "flot",
"seriesOverrides": [],
"spaceLength": 10,
"stack": false,
"steppedLine": false,
"targets": [
{
"datasource": {
"type": "prometheus",
"uid": "${DS_PROMETHEUS}"
},
"editorMode": "code",
"expr": "redis_connected_clients{env=~\"$env\",function=~\"$function\",instance=~\"$instance\"}",
"format": "time_series",
"intervalFactor": 1,
"legendFormat": "connected: {{ instance }}",
"range": true,
"refId": "A"
},
{
"datasource": {
"type": "prometheus",
"uid": "${DS_PROMETHEUS}"
},
"editorMode": "code",
"expr": "redis_blocked_clients{env=~\"$env\",function=~\"$function\"}",
"format": "time_series",
"hide": true,
"intervalFactor": 1,
"legendFormat": "blocked: {{ instance }}",
"range": true,
"refId": "B"
}
],
"thresholds": [],
"timeRegions": [],
"title": "連接與拒絕的客戶端",
"tooltip": {
"shared": true,
"sort": 2,
"value_type": "individual"
},
"type": "graph",
"xaxis": {
"mode": "time",
"show": true,
"values": []
},
"yaxes": [
{
"$$hashKey": "object:1676",
"format": "short",
"logBase": 1,
"show": true
},
{
"$$hashKey": "object:1677",
"format": "short",
"logBase": 1,
"show": true
}
],
"yaxis": {
"align": false
}
},
{
"aliasColors": {
"max": "#BF1B00"
},
"bars": false,
"dashLength": 10,
"dashes": false,
"datasource": {
"type": "prometheus",
"uid": "${DS_PROMETHEUS}"
},
"editable": true,
"error": false,
"fill": 1,
"fillGradient": 0,
"grid": {},
"gridPos": {
"h": 10,
"w": 12,
"x": 0,
"y": 54
},
"hiddenSeries": false,
"id": 22,
"isNew": true,
"legend": {
"alignAsTable": true,
"avg": false,
"current": true,
"hideEmpty": false,
"hideZero": false,
"max": false,
"min": false,
"rightSide": true,
"show": true,
"total": false,
"values": true
},
"lines": true,
"linewidth": 2,
"links": [],
"nullPointMode": "null as zero",
"options": {
"alertThreshold": true
},
"percentage": false,
"pluginVersion": "9.0.3",
"pointradius": 5,
"points": false,
"renderer": "flot",
"seriesOverrides": [],
"spaceLength": 10,
"stack": false,
"steppedLine": false,
"targets": [
{
"datasource": {
"type": "prometheus",
"uid": "${DS_PROMETHEUS}"
},
"editorMode": "code",
"exemplar": true,
"expr": "(redis_memory_used_bytes{env=~\"$env\",function=~\"$function\",instance=~\"$instance\"} / redis_memory_max_bytes{env=~\"$env\",function=~\"$function\",instance=~\"$instance\"})*100",
"format": "time_series",
"interval": "",
"intervalFactor": 2,
"legendFormat": "used: {{ instance }}",
"metric": "",
"range": true,
"refId": "A",
"step": 240,
"target": ""
}
],
"thresholds": [],
"timeRegions": [],
"title": "記憶體使用率",
"tooltip": {
"msResolution": false,
"shared": true,
"sort": 0,
"value_type": "cumulative"
},
"type": "graph",
"xaxis": {
"mode": "time",
"show": true,
"values": []
},
"yaxes": [
{
"$$hashKey": "object:433",
"format": "percent",
"logBase": 1,
"min": 0,
"show": true
},
{
"$$hashKey": "object:434",
"format": "short",
"label": "",
"logBase": 1,
"show": true
}
],
"yaxis": {
"align": false
}
},
{
"aliasColors": {},
"bars": false,
"dashLength": 10,
"dashes": false,
"datasource": {
"type": "prometheus",
"uid": "${DS_PROMETHEUS}"
},
"decimals": 2,
"editable": true,
"error": false,
"fill": 1,
"fillGradient": 0,
"grid": {},
"gridPos": {
"h": 10,
"w": 12,
"x": 12,
"y": 54
},
"hiddenSeries": false,
"id": 24,
"isNew": true,
"legend": {
"alignAsTable": true,
"avg": false,
"current": true,
"max": false,
"min": false,
"rightSide": true,
"show": true,
"total": false,
"values": true
},
"lines": true,
"linewidth": 2,
"links": [],
"nullPointMode": "connected",
"options": {
"alertThreshold": true
},
"percentage": true,
"pluginVersion": "9.0.3",
"pointradius": 5,
"points": false,
"renderer": "flot",
"seriesOverrides": [],
"spaceLength": 10,
"stack": false,
"steppedLine": false,
"targets": [
{
"datasource": {
"type": "prometheus",
"uid": "${DS_PROMETHEUS}"
},
"editorMode": "code",
"exemplar": true,
"expr": "irate(redis_keyspace_hits_total{env=~\"$env\",function=~\"$function\",instance=~\"$instance\"}[2s])",
"format": "time_series",
"hide": false,
"interval": "",
"intervalFactor": 2,
"legendFormat": "hits: {{ instance }}",
"metric": "",
"range": true,
"refId": "A",
"step": 240,
"target": ""
},
{
"datasource": {
"type": "prometheus",
"uid": "${DS_PROMETHEUS}"
},
"editorMode": "code",
"exemplar": true,
"expr": "irate(redis_keyspace_misses_total{env=~\"$env\",function=~\"$function\",instance=~\"$instance\"}[2s])",
"format": "time_series",
"hide": false,
"interval": "",
"intervalFactor": 2,
"legendFormat": "misses: {{ instance }}",
"metric": "",
"range": true,
"refId": "B",
"step": 240,
"target": ""
}
],
"thresholds": [],
"timeRegions": [],
"title": "每秒命中和未命中數量",
"tooltip": {
"msResolution": false,
"shared": true,
"sort": 0,
"value_type": "individual"
},
"type": "graph",
"xaxis": {
"mode": "time",
"show": true,
"values": []
},
"yaxes": [
{
"$$hashKey": "object:164",
"format": "short",
"label": "",
"logBase": 1,
"min": 0,
"show": true
},
{
"$$hashKey": "object:165",
"format": "short",
"logBase": 1,
"show": true
}
],
"yaxis": {
"align": false
}
},
{
"aliasColors": {},
"bars": false,
"dashLength": 10,
"dashes": false,
"datasource": {
"type": "prometheus",
"uid": "${DS_PROMETHEUS}"
},
"description": "",
"editable": true,
"error": false,
"fill": 1,
"fillGradient": 0,
"grid": {},
"gridPos": {
"h": 10,
"w": 12,
"x": 0,
"y": 64
},
"hiddenSeries": false,
"id": 10,
"isNew": true,
"legend": {
"alignAsTable": true,
"avg": false,
"current": true,
"max": true,
"min": false,
"rightSide": true,
"show": true,
"total": false,
"values": true
},
"lines": true,
"linewidth": 2,
"links": [],
"nullPointMode": "connected",
"options": {
"alertThreshold": true
},
"percentage": false,
"pluginVersion": "9.0.3",
"pointradius": 5,
"points": false,
"renderer": "flot",
"seriesOverrides": [],
"spaceLength": 10,
"stack": false,
"steppedLine": false,
"targets": [
{
"datasource": {
"type": "prometheus",
"uid": "${DS_PROMETHEUS}"
},
"editorMode": "code",
"exemplar": true,
"expr": "irate(redis_net_input_bytes_total{env=~\"$env\",function=~\"$function\",instance=~\"$instance\"}[2s])",
"format": "time_series",
"interval": "",
"intervalFactor": 2,
"legendFormat": "input: {{ instance }}",
"range": true,
"refId": "A",
"step": 240
},
{
"datasource": {
"type": "prometheus",
"uid": "${DS_PROMETHEUS}"
},
"editorMode": "code",
"exemplar": true,
"expr": "irate(redis_net_output_bytes_total{env=~\"$env\",function=~\"$function\",instance=~\"$instance\"}[2s])",
"format": "time_series",
"interval": "",
"intervalFactor": 2,
"legendFormat": "output: {{ instance }}",
"range": true,
"refId": "B",
"step": 240
}
],
"thresholds": [],
"timeRegions": [],
"title": "每秒網路流量",
"tooltip": {
"msResolution": true,
"shared": true,
"sort": 0,
"value_type": "cumulative"
},
"type": "graph",
"xaxis": {
"mode": "time",
"show": true,
"values": []
},
"yaxes": [
{
"$$hashKey": "object:377",
"format": "bytes",
"logBase": 1,
"show": true
},
{
"$$hashKey": "object:378",
"format": "short",
"logBase": 1,
"show": true
}
],
"yaxis": {
"align": false
}
},
{
"aliasColors": {},
"bars": false,
"dashLength": 10,
"dashes": false,
"datasource": {
"type": "prometheus",
"uid": "${DS_PROMETHEUS}"
},
"decimals": 2,
"description": "",
"editable": true,
"error": false,
"fill": 1,
"fillGradient": 0,
"grid": {},
"gridPos": {
"h": 10,
"w": 12,
"x": 12,
"y": 64
},
"hiddenSeries": false,
"id": 1,
"isNew": true,
"legend": {
"alignAsTable": true,
"avg": false,
"current": true,
"max": false,
"min": false,
"rightSide": true,
"show": true,
"total": false,
"values": true
},
"lines": true,
"linewidth": 2,
"links": [],
"nullPointMode": "connected",
"options": {
"alertThreshold": true
},
"percentage": true,
"pluginVersion": "9.0.3",
"pointradius": 5,
"points": false,
"renderer": "flot",
"seriesOverrides": [],
"spaceLength": 10,
"stack": false,
"steppedLine": false,
"targets": [
{
"datasource": {
"type": "prometheus",
"uid": "${DS_PROMETHEUS}"
},
"editorMode": "code",
"exemplar": true,
"expr": "irate(redis_keyspace_hits_total{env=~\"$env\",function=~\"$function\",instance=~\"$instance\"}[2s])/(irate(redis_keyspace_hits_total{env=~\"$env\",function=~\"$function\",instance=~\"$instance\"}[2s])+irate(redis_keyspace_misses_total{env=~\"$env\",function=~\"$function\",instance=~\"$instance\"}[2s]))*100",
"format": "time_series",
"hide": false,
"interval": "",
"intervalFactor": 2,
"legendFormat": "Hits%: {{ instance }}",
"metric": "",
"range": true,
"refId": "C",
"step": 240,
"target": ""
}
],
"thresholds": [],
"timeRegions": [],
"title": "命中率",
"tooltip": {
"msResolution": false,
"shared": true,
"sort": 0,
"value_type": "individual"
},
"type": "graph",
"xaxis": {
"mode": "time",
"show": true,
"values": []
},
"yaxes": [
{
"$$hashKey": "object:164",
"format": "short",
"label": "",
"logBase": 1,
"min": 0,
"show": true
},
{
"$$hashKey": "object:165",
"format": "short",
"logBase": 1,
"show": true
}
],
"yaxis": {
"align": false
}
},
{
"aliasColors": {},
"bars": false,
"dashLength": 10,
"dashes": false,
"datasource": {
"type": "prometheus",
"uid": "${DS_PROMETHEUS}"
},
"description": "Total Time Spent by Command / sec",
"editable": true,
"error": false,
"fieldConfig": {
"defaults": {
"links": []
},
"overrides": []
},
"fill": 0,
"fillGradient": 0,
"grid": {},
"gridPos": {
"h": 9,
"w": 12,
"x": 0,
"y": 74
},
"hiddenSeries": false,
"id": 46,
"isNew": true,
"legend": {
"alignAsTable": true,
"avg": false,
"current": true,
"hideEmpty": true,
"hideZero": true,
"max": true,
"min": false,
"rightSide": true,
"show": true,
"sort": "max",
"sortDesc": true,
"total": false,
"values": true
},
"lines": true,
"linewidth": 1,
"links": [],
"nullPointMode": "null as zero",
"options": {
"alertThreshold": true
},
"percentage": false,
"pluginVersion": "9.0.3",
"pointradius": 5,
"points": false,
"renderer": "flot",
"seriesOverrides": [],
"spaceLength": 10,
"stack": false,
"steppedLine": false,
"targets": [
{
"datasource": {
"type": "prometheus",
"uid": "${DS_PROMETHEUS}"
},
"expr": "sum(irate(redis_commands_duration_seconds_total{env=~\"$env\",function=~\"$function\",instance=~\"$instance\"}[2m])) by (cmd) != 0",
"format": "time_series",
"interval": "",
"intervalFactor": 2,
"legendFormat": "{{ cmd }}",
"metric": "redis_command_calls_total",
"refId": "A",
"step": 240
}
],
"thresholds": [],
"timeRegions": [],
"title": "每秒命令花費的總時長",
"tooltip": {
"msResolution": true,
"shared": true,
"sort": 2,
"value_type": "individual"
},
"type": "graph",
"xaxis": {
"mode": "time",
"show": true,
"values": []
},
"yaxes": [
{
"$$hashKey": "object:1761",
"format": "s",
"logBase": 1,
"show": true
},
{
"$$hashKey": "object:1762",
"format": "short",
"logBase": 1,
"show": true
}
],
"yaxis": {
"align": false
}
},
{
"aliasColors": {},
"bars": false,
"dashLength": 10,
"dashes": false,
"datasource": {
"type": "prometheus",
"uid": "${DS_PROMETHEUS}"
},
"description": "Average Time Spent by Command / sec",
"editable": true,
"error": false,
"fieldConfig": {
"defaults": {
"links": []
},
"overrides": []
},
"fill": 0,
"fillGradient": 0,
"grid": {},
"gridPos": {
"h": 9,
"w": 12,
"x": 12,
"y": 74
},
"hiddenSeries": false,
"id": 44,
"isNew": true,
"legend": {
"alignAsTable": true,
"avg": false,
"current": true,
"hideEmpty": false,
"hideZero": true,
"max": true,
"min": false,
"rightSide": true,
"show": true,
"sort": "max",
"sortDesc": true,
"total": false,
"values": true
},
"lines": true,
"linewidth": 1,
"links": [],
"nullPointMode": "connected",
"options": {
"alertThreshold": true
},
"percentage": false,
"pluginVersion": "9.0.3",
"pointradius": 5,
"points": false,
"renderer": "flot",
"seriesOverrides": [],
"spaceLength": 10,
"stack": false,
"steppedLine": false,
"targets": [
{
"datasource": {
"type": "prometheus",
"uid": "${DS_PROMETHEUS}"
},
"expr": "sum(irate(redis_commands_duration_seconds_total{env=~\"$env\",function=~\"$function\",instance=~\"$instance\"}[2m])) by (cmd)\n /\nsum(irate(redis_commands_total{env=~\"$env\",function=~\"$function\",instance=~\"$instance\"}[2m])) by (cmd)\n",
"format": "time_series",
"interval": "",
"intervalFactor": 2,
"legendFormat": "{{ cmd }}",
"metric": "redis_command_calls_total",
"refId": "A",
"step": 240
}
],
"thresholds": [],
"timeRegions": [],
"title": "命令執行平均耗時",
"tooltip": {
"msResolution": true,
"shared": true,
"sort": 2,
"value_type": "individual"
},
"type": "graph",
"xaxis": {
"mode": "time",
"show": true,
"values": []
},
"yaxes": [
{
"$$hashKey": "object:1589",
"format": "s",
"logBase": 1,
"show": true
},
{
"$$hashKey": "object:1590",
"format": "short",
"logBase": 1,
"show": true
}
],
"yaxis": {
"align": false
}
},
{
"aliasColors": {},
"bars": false,
"dashLength": 10,
"dashes": false,
"datasource": {
"type": "prometheus",
"uid": "${DS_PROMETHEUS}"
},
"description": "",
"editable": true,
"error": false,
"fill": 7,
"fillGradient": 0,
"grid": {},
"gridPos": {
"h": 9,
"w": 12,
"x": 0,
"y": 83
},
"hiddenSeries": false,
"id": 13,
"isNew": true,
"legend": {
"alignAsTable": true,
"avg": false,
"current": true,
"max": false,
"min": false,
"rightSide": true,
"show": true,
"total": false,
"values": true
},
"lines": true,
"linewidth": 2,
"links": [],
"nullPointMode": "connected",
"options": {
"alertThreshold": true
},
"percentage": false,
"pluginVersion": "9.0.3",
"pointradius": 5,
"points": false,
"renderer": "flot",
"seriesOverrides": [],
"spaceLength": 10,
"stack": true,
"steppedLine": false,
"targets": [
{
"datasource": {
"type": "prometheus",
"uid": "${DS_PROMETHEUS}"
},
"editorMode": "code",
"expr": "sum (redis_db_keys{env=~\"$env\",function=~\"$function\",instance=~\"$instance\"}) - sum (redis_db_keys_expiring{env=~\"$env\",function=~\"$function\",instance=~\"$instance\"}) by (instance)",
"format": "time_series",
"interval": "",
"intervalFactor": 2,
"legendFormat": "not expiring: {{ instance }}",
"range": true,
"refId": "A",
"step": 240,
"target": ""
},
{
"datasource": {
"type": "prometheus",
"uid": "${DS_PROMETHEUS}"
},
"editorMode": "code",
"expr": "sum (redis_db_keys_expiring{env=~\"$env\",function=~\"$function\",instance=~\"$instance\"}) by (instance)",
"format": "time_series",
"interval": "",
"intervalFactor": 2,
"legendFormat": "expiring: {{ instance }}",
"metric": "",
"range": true,
"refId": "B",
"step": 240
}
],
"thresholds": [],
"timeRegions": [],
"title": "過期與未過期的Keys",
"tooltip": {
"msResolution": false,
"shared": true,
"sort": 0,
"value_type": "individual"
},
"type": "graph",
"xaxis": {
"mode": "time",
"show": true,
"values": []
},
"yaxes": [
{
"$$hashKey": "object:171",
"format": "short",
"logBase": 1,
"show": true
},
{
"$$hashKey": "object:172",
"format": "short",
"logBase": 1,
"show": true
}
],
"yaxis": {
"align": false
}
},
{
"aliasColors": {},
"bars": false,
"dashLength": 10,
"dashes": false,
"datasource": {
"type": "prometheus",
"uid": "${DS_PROMETHEUS}"
},
"description": "This metric will only be non-zero if the instance is a master",
"fieldConfig": {
"defaults": {
"links": []
},
"overrides": []
},
"fill": 1,
"fillGradient": 0,
"gridPos": {
"h": 9,
"w": 12,
"x": 12,
"y": 83
},
"hiddenSeries": false,
"id": 48,
"legend": {
"alignAsTable": true,
"avg": false,
"current": true,
"max": false,
"min": false,
"rightSide": true,
"show": true,
"total": false,
"values": true
},
"lines": true,
"linewidth": 1,
"nullPointMode": "null",
"options": {
"alertThreshold": true
},
"percentage": false,
"pluginVersion": "9.0.3",
"pointradius": 2,
"points": false,
"renderer": "flot",
"seriesOverrides": [],
"spaceLength": 10,
"stack": false,
"steppedLine": false,
"targets": [
{
"datasource": {
"type": "prometheus",
"uid": "${DS_PROMETHEUS}"
},
"editorMode": "code",
"expr": "sum(redis_connected_slaves{env=~\"$env\",function=~\"$function\",instance=~\"$instance\"}) by (instance)",
"interval": "",
"legendFormat": "{{ instance }}",
"range": true,
"refId": "A"
}
],
"thresholds": [],
"timeRegions": [],
"title": "被連接的Slave數量",
"tooltip": {
"shared": true,
"sort": 0,
"value_type": "individual"
},
"type": "graph",
"xaxis": {
"mode": "time",
"show": true,
"values": []
},
"yaxes": [
{
"$$hashKey": "object:2097",
"decimals": 1,
"format": "short",
"label": "",
"logBase": 1,
"show": true
},
{
"$$hashKey": "object:2098",
"format": "short",
"logBase": 1,
"show": true
}
],
"yaxis": {
"align": false
}
},
{
"aliasColors": {
"max": "#BF1B00"
},
"bars": false,
"dashLength": 10,
"dashes": false,
"datasource": {
"type": "prometheus",
"uid": "${DS_PROMETHEUS}"
},
"editable": true,
"error": false,
"fill": 1,
"fillGradient": 0,
"grid": {},
"gridPos": {
"h": 9,
"w": 12,
"x": 0,
"y": 92
},
"hiddenSeries": false,
"id": 26,
"isNew": true,
"legend": {
"alignAsTable": true,
"avg": false,
"current": true,
"hideEmpty": false,
"hideZero": false,
"max": false,
"min": false,
"rightSide": true,
"show": true,
"total": false,
"values": true
},
"lines": true,
"linewidth": 2,
"links": [],
"nullPointMode": "null as zero",
"options": {
"alertThreshold": true
},
"percentage": false,
"pluginVersion": "9.0.3",
"pointradius": 5,
"points": false,
"renderer": "flot",
"seriesOverrides": [],
"spaceLength": 10,
"stack": false,
"steppedLine": false,
"targets": [
{
"datasource": {
"type": "prometheus",
"uid": "${DS_PROMETHEUS}"
},
"editorMode": "code",
"exemplar": true,
"expr": "redis_mem_fragmentation_bytes{env=~\"$env\",function=~\"$function\",instance=~\"$instance\"}",
"format": "time_series",
"interval": "",
"intervalFactor": 2,
"legendFormat": "used: {{ instance }}",
"metric": "",
"range": true,
"refId": "A",
"step": 240,
"target": ""
}
],
"thresholds": [],
"timeRegions": [],
"title": "破碎記憶體使用",
"tooltip": {
"msResolution": false,
"shared": true,
"sort": 0,
"value_type": "cumulative"
},
"type": "graph",
"xaxis": {
"mode": "time",
"show": true,
"values": []
},
"yaxes": [
{
"$$hashKey": "object:433",
"format": "bytes",
"logBase": 1,
"min": 0,
"show": true
},
{
"$$hashKey": "object:434",
"format": "short",
"logBase": 1,
"show": true
}
],
"yaxis": {
"align": false
}
},
{
"aliasColors": {
"evicts": "#890F02",
"memcached_items_evicted_total{instance=\"172.17.0.1:9150\",job=\"prometheus\"}": "#890F02",
"reclaims": "#3F6833"
},
"bars": false,
"dashLength": 10,
"dashes": false,
"datasource": {
"type": "prometheus",
"uid": "${DS_PROMETHEUS}"
},
"editable": true,
"error": false,
"fill": 1,
"fillGradient": 0,
"grid": {},
"gridPos": {
"h": 9,
"w": 12,
"x": 12,
"y": 92
},
"hiddenSeries": false,
"id": 8,
"isNew": true,
"legend": {
"alignAsTable": true,
"avg": false,
"current": true,
"max": false,
"min": false,
"rightSide": true,
"show": true,
"total": false,
"values": true
},
"lines": true,
"linewidth": 2,
"links": [],
"nullPointMode": "connected",
"options": {
"alertThreshold": true
},
"percentage": false,
"pluginVersion": "9.0.3",
"pointradius": 5,
"points": false,
"renderer": "flot",
"seriesOverrides": [
{
"$$hashKey": "object:314",
"alias": "reclaims",
"yaxis": 2
}
],
"spaceLength": 10,
"stack": false,
"steppedLine": false,
"targets": [
{
"datasource": {
"type": "prometheus",
"uid": "${DS_PROMETHEUS}"
},
"editorMode": "code",
"exemplar": true,
"expr": "sum(rate(redis_expired_keys_total{env=~\"$env\",function=~\"$function\",instance=~\"$instance\"}[2s])) by (instance)",
"format": "time_series",
"hide": false,
"interval": "",
"intervalFactor": 2,
"legendFormat": "expired: {{ instance }}",
"metric": "",
"range": true,
"refId": "A",
"step": 240,
"target": ""
},
{
"datasource": {
"type": "prometheus",
"uid": "${DS_PROMETHEUS}"
},
"editorMode": "code",
"exemplar": true,
"expr": "sum(rate(redis_evicted_keys_total{env=~\"$env\",function=~\"$function\",instance=~\"$instance\"}[2s])) by (instance)",
"format": "time_series",
"interval": "",
"intervalFactor": 2,
"legendFormat": "evicted: {{ instance }}",
"range": true,
"refId": "B",
"step": 240
}
],
"thresholds": [],
"timeRegions": [],
"title": "過期與驅逐的Keys",
"tooltip": {
"msResolution": false,
"shared": true,
"sort": 0,
"value_type": "cumulative"
},
"type": "graph",
"xaxis": {
"mode": "time",
"show": true,
"values": []
},
"yaxes": [
{
"$$hashKey": "object:321",
"format": "short",
"logBase": 1,
"show": true
},
{
"$$hashKey": "object:322",
"format": "short",
"logBase": 1,
"show": true
}
],
"yaxis": {
"align": false
}
},
{
"aliasColors": {},
"bars": false,
"dashLength": 10,
"dashes": false,
"datasource": {
"type": "prometheus",
"uid": "${DS_PROMETHEUS}"
},
"editable": true,
"error": false,
"fill": 8,
"fillGradient": 0,
"grid": {},
"gridPos": {
"h": 10,
"w": 12,
"x": 0,
"y": 101
},
"hiddenSeries": false,
"id": 36,
"isNew": true,
"legend": {
"alignAsTable": true,
"avg": false,
"current": true,
"max": true,
"min": false,
"rightSide": true,
"show": true,
"total": false,
"values": true
},
"lines": true,
"linewidth": 1,
"links": [],
"nullPointMode": "connected",
"options": {
"alertThreshold": true
},
"percentage": false,
"pluginVersion": "9.0.3",
"pointradius": 5,
"points": false,
"renderer": "flot",
"seriesOverrides": [],
"spaceLength": 10,
"stack": true,
"steppedLine": false,
"targets": [
{
"datasource": {
"type": "prometheus",
"uid": "${DS_PROMETHEUS}"
},
"editorMode": "code",
"exemplar": true,
"expr": "sum(irate(redis_commands_total{env=~\"$env\",function=~\"$function\",instance=~\"$instance\",cmd=~\".*get.*\"}[2s])) by (cmd , instance) > 1",
"format": "time_series",
"interval": "",
"intervalFactor": 2,
"legendFormat": "{{ cmd }} {{ instance }}",
"metric": "redis_command_calls_total",
"range": true,
"refId": "A",
"step": 240
}
],
"thresholds": [],
"timeRegions": [],
"title": "每秒操作數(GET.*)",
"tooltip": {
"msResolution": true,
"shared": true,
"sort": 0,
"value_type": "cumulative"
},
"type": "graph",
"xaxis": {
"mode": "time",
"show": true,
"values": []
},
"yaxes": [
{
"$$hashKey": "object:3400",
"format": "short",
"logBase": 1,
"show": true
},
{
"$$hashKey": "object:3401",
"format": "short",
"logBase": 1,
"show": true
}
],
"yaxis": {
"align": false
}
}
],
"refresh": "",
"schemaVersion": 36,
"style": "dark",
"tags": [
"prometheus",
"redis"
],
"templating": {
"list": [
{
"current": {},
"datasource": {
"type": "prometheus",
"uid": "${DS_PROMETHEUS}"
},
"definition": "label_values(redis_up,env)",
"hide": 0,
"includeAll": false,
"label": "env",
"multi": true,
"name": "env",
"options": [],
"query": {
"query": "label_values(redis_up,env)",
"refId": "StandardVariableQuery"
},
"refresh": 2,
"regex": "",
"skipUrlSync": false,
"sort": 0,
"type": "query"
},
{
"current": {},
"datasource": {
"type": "prometheus",
"uid": "${DS_PROMETHEUS}"
},
"definition": "label_values(redis_up{env=\"$env\"},function)",
"hide": 0,
"includeAll": false,
"label": "function",
"multi": true,
"name": "function",
"options": [],
"query": {
"query": "label_values(redis_up{env=\"$env\"},function)",
"refId": "StandardVariableQuery"
},
"refresh": 2,
"regex": "",
"skipUrlSync": false,
"sort": 0,
"type": "query"
},
{
"current": {},
"datasource": {
"type": "prometheus",
"uid": "${DS_PROMETHEUS}"
},
"definition": "label_values(redis_up{env=\"$env\",function=\"$function\"}, instance)",
"hide": 0,
"includeAll": false,
"label": "Instance",
"multi": true,
"name": "instance",
"options": [],
"query": {
"query": "label_values(redis_up{env=\"$env\",function=\"$function\"}, instance)",
"refId": "StandardVariableQuery"
},
"refresh": 2,
"regex": "",
"skipUrlSync": false,
"sort": 1,
"tagValuesQuery": "",
"tagsQuery": "",
"type": "query",
"useTags": false
},
{
"datasource": {
"type": "prometheus",
"uid": "372QZZR4k"
},
"filters": [],
"hide": 0,
"label": "",
"name": "Filters",
"skipUrlSync": false,
"type": "adhoc"
}
]
},
"time": {
"from": "now-1h",
"to": "now"
},
"timepicker": {
"refresh_intervals": [
"5s",
"10s",
"30s",
"1m",
"5m",
"15m",
"30m",
"1h",
"2h",
"1d"
],
"time_options": [
"5m",
"15m",
"1h",
"6h",
"12h",
"24h",
"2d",
"7d",
"30d"
]
},
"timezone": "browser",
"title": "Redis Dashboard for Prometheus Redis Exporter 1.x",
"uid": "OHW0aysnk",
"version": 125,
"weekStart": ""
}
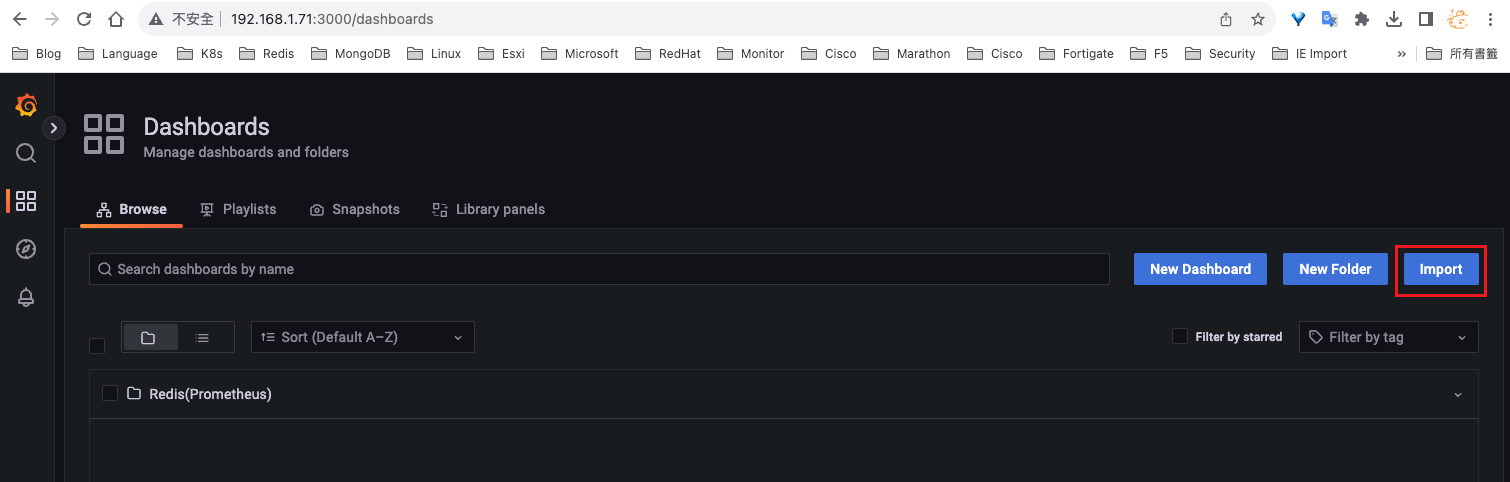
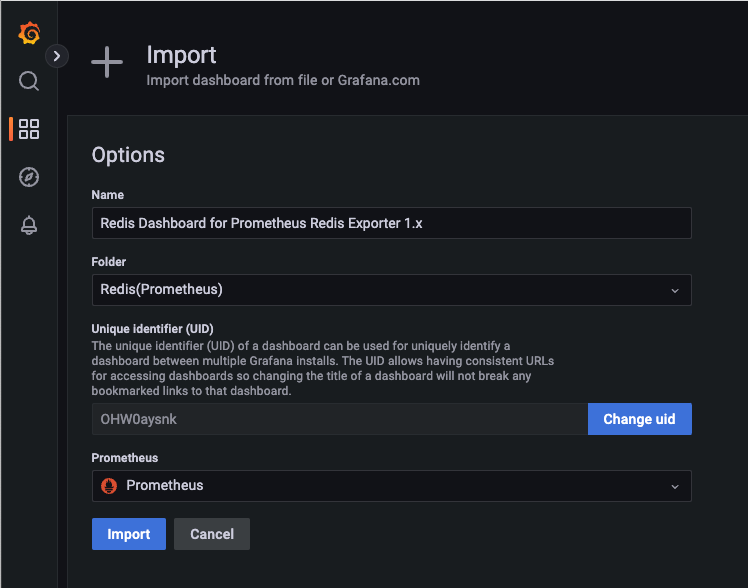
目前不會有值,因為還沒有開始監控Redis
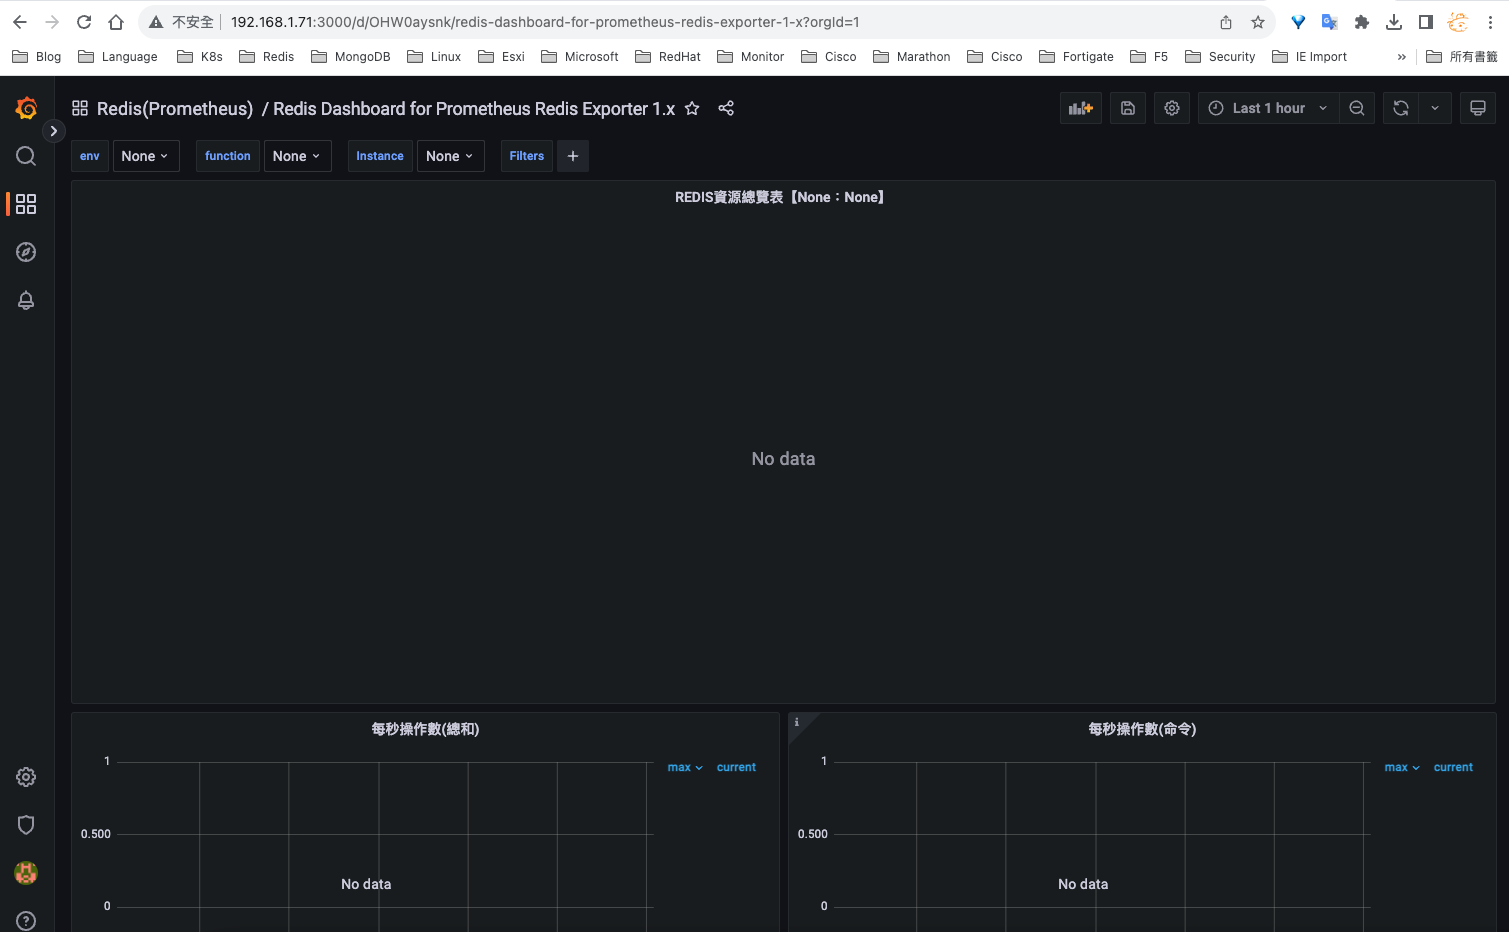
step5 thanos_compactor、thanos_bucket、thanos_rule
主機: k8s-master72u (192.168.1.72)
mkdir -p ./thanos/compact_data
chmod -R 777 ./thanos/compact_data

mkdir -p ./thanos/rule_data/{data,rules,conf}
chmod -R 777 ./thanos/rule_data
啟動thanos_compactor、thanos_bucket、thanos_rule
root@k8s-master72u:/data/thanos-docker-compose# docker-compose up -d bucket_web
root@k8s-master72u:/data/thanos-docker-compose# docker-compose up -d thanos_compactor
root@k8s-master72u:/data/thanos-docker-compose# docker-compose up -d thanos_rule


root@k8s-master72u:/data/thanos-docker-compose# docker-compose ps
       Name                     Command               State                                        Ports
----------------------------------------------------------------------------------------------------------------------------------------------
alertmanager         /bin/alertmanager --config ...   Up      0.0.0.0:9093->9093/tcp,:::9093->9093/tcp,
                                                              0.0.0.0:9094->9094/tcp,:::9094->9094/tcp
bucket_web           /bin/thanos tools bucket w ...   Up      0.0.0.0:19194->19194/tcp,:::19194->19194/tcp
prometheus_one       /bin/prometheus --web.read ...   Up      0.0.0.0:9090->9090/tcp,:::9090->9090/tcp
thanos_compactor     /bin/thanos compact --log. ...   Up
thanos_querier       /bin/thanos query --http-a ...   Up      0.0.0.0:19192->19192/tcp,:::19192->19192/tcp
thanos_rule          /bin/thanos rule --grpc-ad ...   Up      0.0.0.0:10905->10905/tcp,:::10905->10905/tcp,
                                                              0.0.0.0:19193->19193/tcp,:::19193->19193/tcp
thanos_sidecar_one   /bin/thanos sidecar --log. ...   Up
thanos_store         /bin/thanos store --data-d ...   Up      0.0.0.0:29090->19090/tcp,:::29090->19090/tcp,
                                                              0.0.0.0:29191->19191/tcp,:::29191->19191/tcp, 29090/tcp, 29191/tcp
測試
http://192.168.1.72:19194/blocks
要minio有bucket時,這裡才會有數據顯示
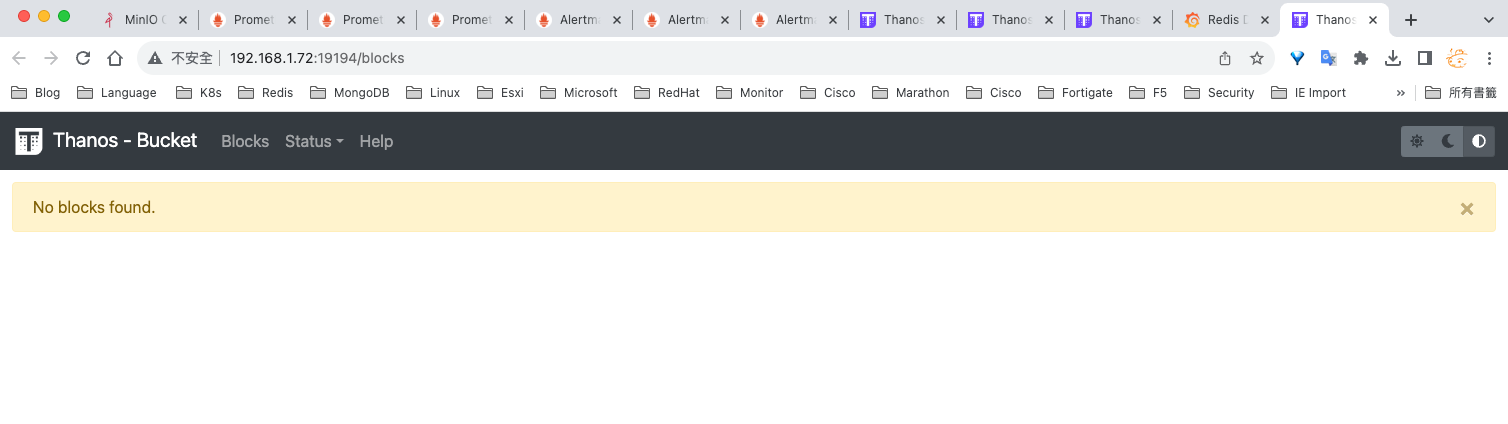
step6 redis_exporter
docker-compose方式安裝redis_exporter:
主機: k8s-master71u (192.168.1.71)、k8s-master72u (192.168.1.72)、k8s-master73u (192.168.1.73)
目錄架構
.
├── .env
├── docker-compose.yml
└── etc
    ├── localtime
    └── timezone
docker-compose.yml
version: '3.2'
services:
  # 帶帳號密碼
  redis_exporter_one:
    image: oliver006/redis_exporter
    container_name: redis_exporter_one
    volumes:
      - ./etc/localtime:/etc/localtime
      - ./etc/timezone:/etc/timezone
    command:
      - '--redis.addr=${REDIS_EXPORTER_IP}:6379'
      - '--redis.user=${REDIS_USER}'
      - '--redis.password=${REDIS_PASSWORD}'
      - '--include-system-metrics=true'
    restart: unless-stopped
    expose:
      - 9121
    ports:
      - "9121:9121"

  # 不帶帳號密碼
  redis_exporter_two:
    image: oliver006/redis_exporter
    container_name: redis_exporter_two
    volumes:
      - ./etc/localtime:/etc/localtime
      - ./etc/timezone:/etc/timezone
    command:
      - '--redis.addr=${REDIS_EXPORTER_IP}:6379'
      - '--include-system-metrics=true'
    restart: unless-stopped
    expose:
      - 9122
    ports:
      - "9122:9121"
.env需依照環境修改部分:
# 1. REDIS_EXPORTER_IP 填寫當下安裝redis_exporter的主機IP
# 2. REDIS_USER 填寫redis_exporter連線redis使用的帳號
# 3. REDIS_PASSWORD 填寫redis_exporter連線redis使用的密碼

root@k8s-master71u:/data/redis_exporter# cat .env
REDIS_EXPORTER_IP=192.168.1.71
REDIS_USER=prometheus-user
REDIS_PASSWORD=1234
啟動redis_exporter
root@k8s-master71u:/data/redis-exporter# docker-compose up -d redis_exporter_one
root@k8s-master72u:/data/redis-exporter# docker-compose up -d redis_exporter_one
root@k8s-master73u:/data/redis-exporter# docker-compose up -d redis_exporter_one

root@k8s-master71u:/data/redis-exporter# docker-compose up -d redis_exporter_two
root@k8s-master72u:/data/redis-exporter# docker-compose up -d redis_exporter_two
root@k8s-master73u:/data/redis-exporter# docker-compose up -d redis_exporter_two


root@k8s-master71u:/data/redis_exporter# docker-compose ps
       Name                     Command               State                         Ports
----------------------------------------------------------------------------------------------------------------
redis_exporter_one   /redis_exporter REDIS_ADDR ...   Up      0.0.0.0:9121->9121/tcp,:::9121->9121/tcp
redis_exporter_two   /redis_exporter REDIS_ADDR ...   Up      0.0.0.0:9122->9121/tcp,:::9122->9121/tcp, 9122/tcp


root@k8s-master72u:/data/redis_exporter# docker-compose ps
       Name                     Command               State                         Ports
----------------------------------------------------------------------------------------------------------------
redis_exporter_one   /redis_exporter REDIS_ADDR ...   Up      0.0.0.0:9121->9121/tcp,:::9121->9121/tcp
redis_exporter_two   /redis_exporter REDIS_ADDR ...   Up      0.0.0.0:9122->9121/tcp,:::9122->9121/tcp, 9122/tcp


root@k8s-master73u:/data/redis_exporter# docker-compose ps
       Name                     Command               State                         Ports
----------------------------------------------------------------------------------------------------------------
redis_exporter_one   /redis_exporter REDIS_ADDR ...   Up      0.0.0.0:9121->9121/tcp,:::9121->9121/tcp
redis_exporter_two   /redis_exporter REDIS_ADDR ...   Up      0.0.0.0:9122->9121/tcp,:::9122->9121/tcp, 9122/tcp
prometheus添加監控,並重啟
root@k8s-master71u:/data/thanos-docker-compose# vim prometheus/conf/sd_config/t1zone-redis/web-front.json
[
  {
    "targets": ["redis://192.168.1.11:6379", "redis://192.168.1.12:6379"],
    "labels": {"env":"t1zone","function":"web-front"}
  }
]

root@k8s-master71u:/data/thanos-docker-compose# vim prometheus/conf/sd_config/t2zone-redis/search.json
[
  {
    "targets": ["redis://192.168.1.13:6379", "redis://192.168.1.14:6379"],
    "labels": {"env":"t2zone","function":"search"}
  }
]


root@k8s-master71u:/data/thanos-docker-compose# vim prometheus/conf/prometheus.yml
  #redis自動發現
  - job_name: 't1zone-Redis-web-front'
    file_sd_configs:
      - files:
        - /etc/prometheus/sd_config/t1zone-redis/web-front.json
    metrics_path: /scrape
    relabel_configs:
      - source_labels: [__address__]
        target_label: __param_target
      - source_labels: [__param_target]
        target_label: instance
      - target_label: __address__
        replacement: 192.168.1.71:9121

  - job_name: 't2zone-Redis-search'
    file_sd_configs:
      - files:
        - /etc/prometheus/sd_config/t2zone-redis/search.json
    metrics_path: /scrape
    relabel_configs:
      - source_labels: [__address__]
        target_label: __param_target
      - source_labels: [__param_target]
        target_label: instance
      - target_label: __address__
        replacement: 192.168.1.71:9122

root@k8s-master71u:/data/thanos-docker-compose# docker-compose restart prometheus_one
測試
http://192.168.1.71:19192/targets
Target有偵測到了
有帳號密碼的
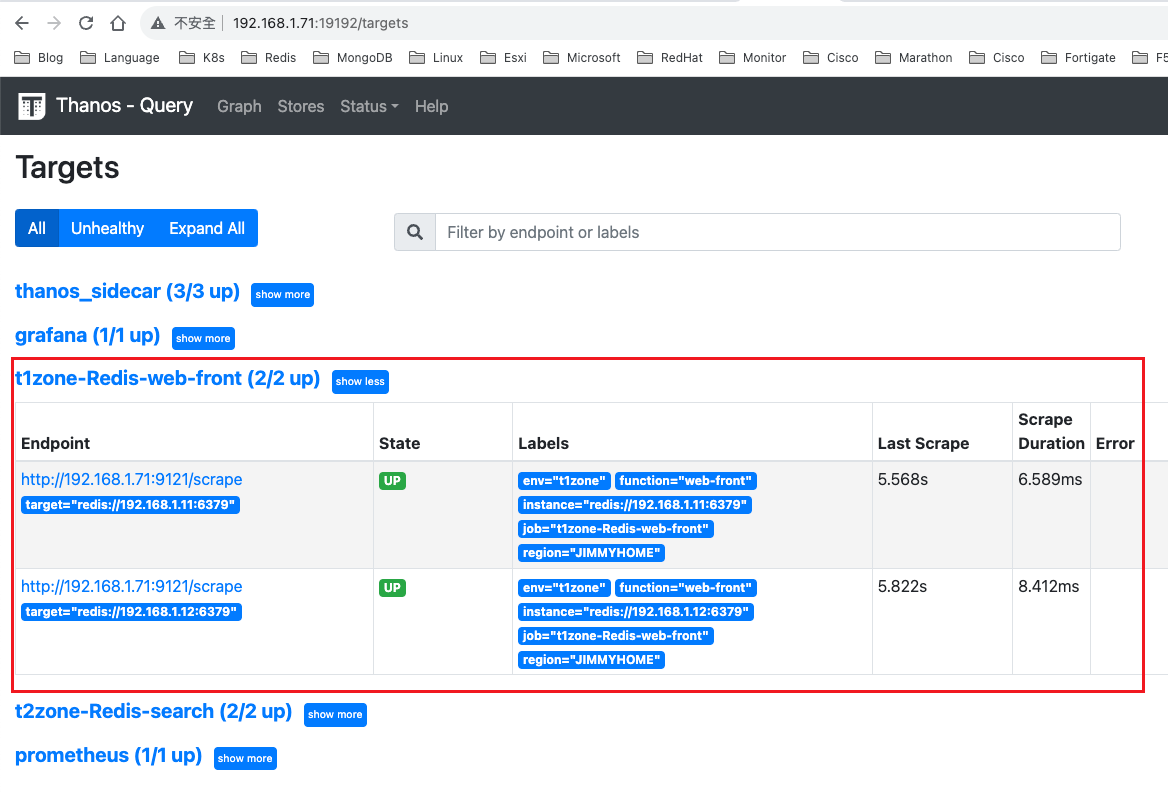
沒帳號密碼的
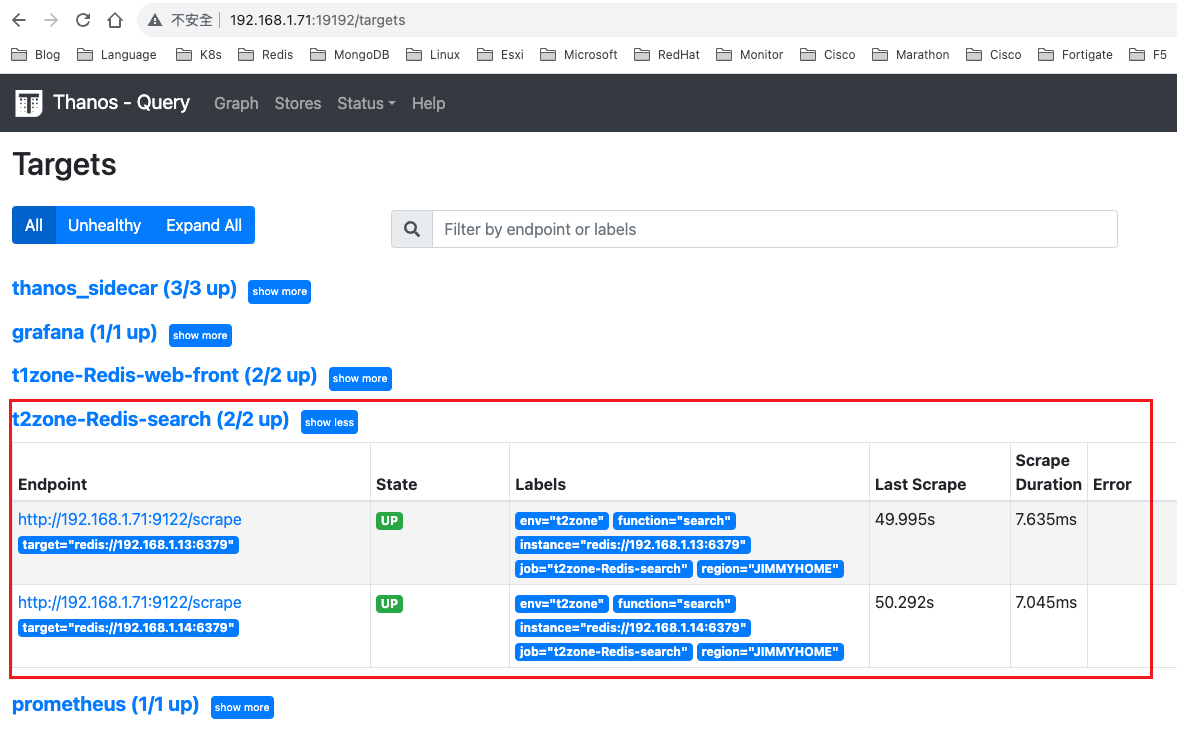 也有收集到redis指標
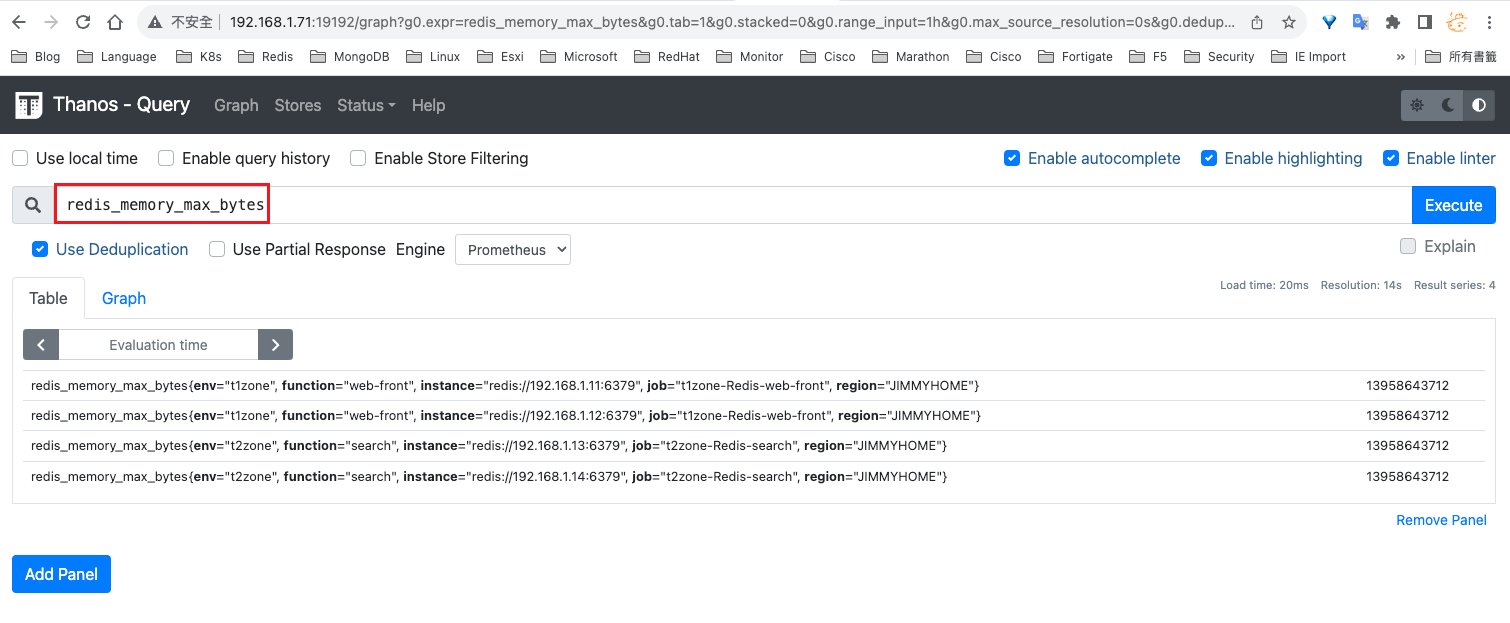
grafana也可以看到redis監控資訊
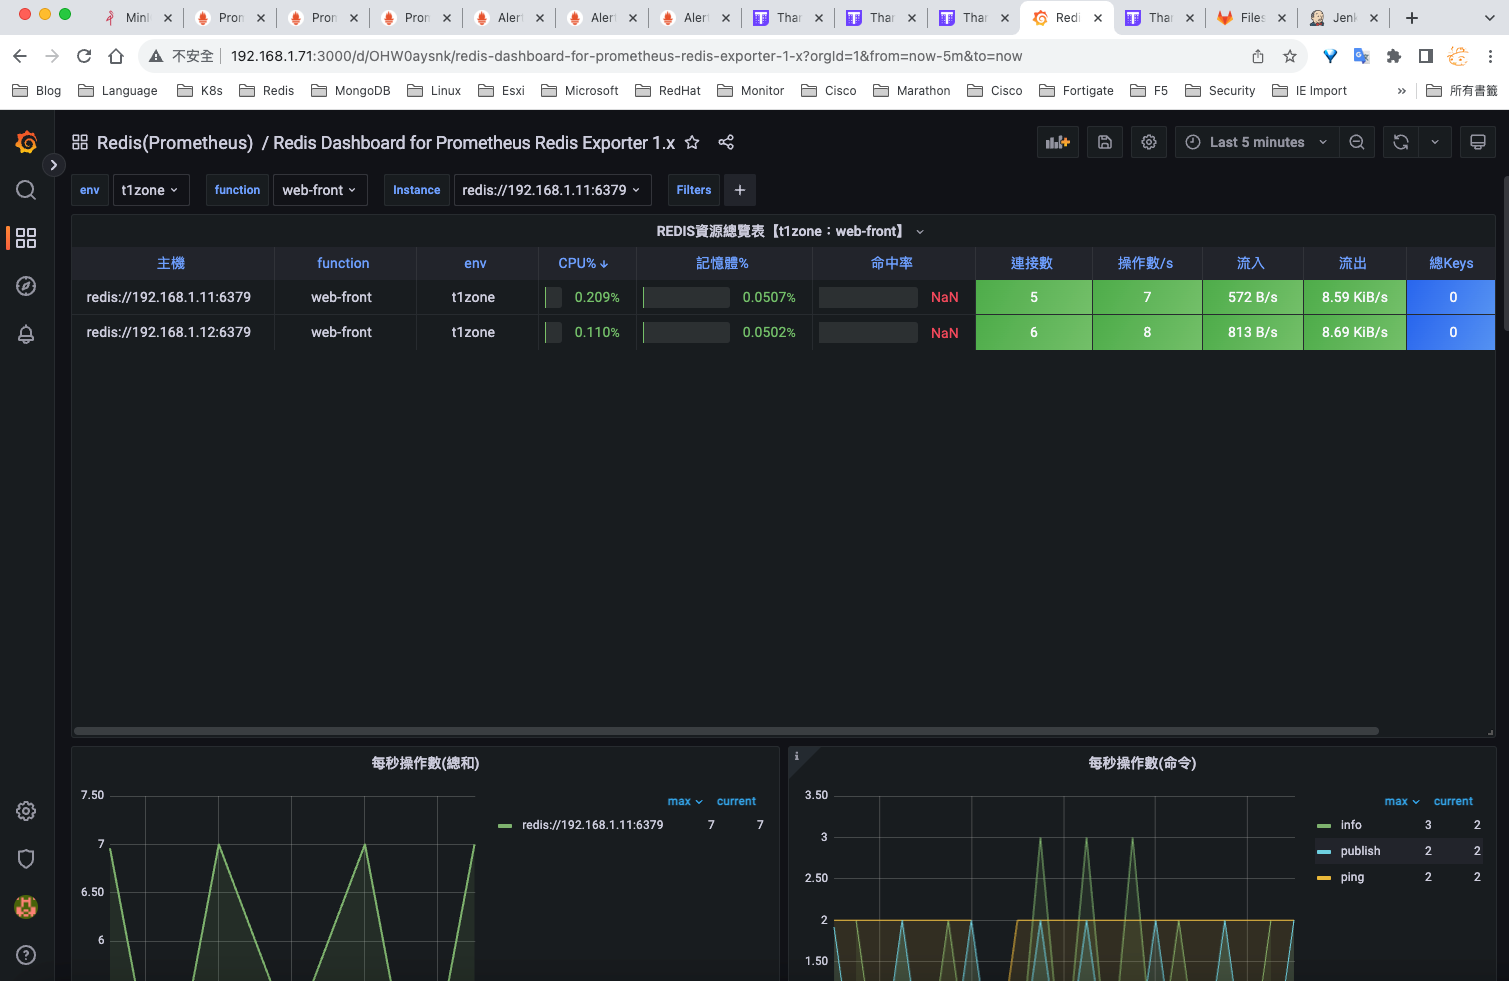
二進制方式安裝redis_exporter:
起兩個redis_exporter服務,因為
redis5.x版的,沒有acl可以設定帳號和密碼,用redis_exporter2來監控
redis6.x版的,有acl可以設定帳號和密碼,用redis_exporter來監控,帳號prometheus-user,-redis.password XXXX,XXXX依現況修改
redis所有主機,都要先新增prometheus-user帳號,權限,-@all +info +get +config|get +client +xinfo +xlen +scard +latency +llen +pfcount +strlen +type +cluster|info +memory +ping +scan +zcard +eval +slowlog +hlen +select
cd ~
wget https://github.com/oliver006/redis_exporter/releases/download/v1.52.0/redis_exporter-v1.52.0.linux-amd64.tar.gz
tar xzvf redis_exporter-v1.52.0.linux-amd64.tar.gz
mv redis_exporter-v1.52.0.linux-amd64 /usr/local/redis_exporter

root@k8s-master71u:/data# vim /etc/systemd/system/redis_exporter.service

[Unit]
Description=redis_exporter
Documentation=https://github.com/oliver006/redis_exporter
After=network.target
[Service]
Type=simple
ExecStart=/usr/local/redis_exporter/redis_exporter -redis.addr 10.90.87.240:6379 -redis.user prometheus-user -redis.password XXXX -web.listen-address=:9121
Restart=on-failure
[Install]
WantedBy=multi-user.target


root@k8s-master71u:/data# vim /etc/systemd/system/redis_exporter2.service
[Unit]
Description=redis_exporter2
Documentation=https://github.com/oliver006/redis_exporter
After=network.target
[Service]
Type=simple
ExecStart=/usr/local/redis_exporter/redis_exporter -redis.addr 10.90.87.240:6380 -web.listen-address=:9122
Restart=on-failure
[Install]
WantedBy=multi-user.target


root@k8s-master71u:/data# systemctl daemon-reload


root@k8s-master71u:/data# systemctl start redis_exporter
root@k8s-master71u:/data# systemctl start redis_exporter2
root@k8s-master71u:/data# systemctl enable redis_exporter
root@k8s-master71u:/data# systemctl enable redis_exporter2
root@k8s-master71u:/data# systemctl status redis_exporter
root@k8s-master71u:/data# systemctl status redis_exporter2
ExecStart=/usr/local/redis_exporter/redis_exporter -redis.addr 10.90.87.240:6379 -redis.user prometheus-user -redis.password XXXX -web.listen-address=:9121
#10.90.87.240:6379 搭配 -web.listen-address=:9121
ExecStart=/usr/local/redis_exporter/redis_exporter -redis.addr 10.90.87.240:6380 -web.listen-address=:9122
#10.90.87.240:6380 搭配 -web.listen-address=:9122